

On this page
Mix two clear liquids in a beaker, start a stopwatch, and wait. For a few tense seconds, absolutely nothing seems to happen. The liquids look like water, and there is no bubbling or fizzing to tell you a reaction is underway. Then, in the blink of an eye, the entire solution flashes a deep, opaque blue-black.
This is the iodine clock reaction, one of the most famous and visually striking experiments in chemical kinetics. Beyond looking like an impressive magic trick, it provides a precise way to measure how fast a chemical reaction happens. By systematically changing the amount of reactants, you can predict exactly when the colour will change, turning the reaction into a reliable chemical timer.
If you are preparing for the Class 12 chemistry practicals or tackling kinetics for JEE and NEET, the iodine clock reaction serves as a practical, hands-on proof that reaction rates depend heavily on concentration. But how exactly does the timing change when you dilute a solution, and why do we routinely plot the inverse of time (1/t) to make sense of the data?
What causes the sudden blue flash?
The classic iodine clock reaction, often done with potassium iodate and sodium sulphite, actually happens in hidden steps.
First, the iodate and sulphite ions react to slowly produce iodide ions. Then, in a fast second step, those iodide ions react with the remaining iodate to form molecular iodine.
Usually, iodine would turn the solution brown. But there is a catch: the sulphite present in the mixture immediately consumes the iodine as soon as it forms. This invisible tug-of-war continues until the sulphite completely runs out. The moment the sulphite is exhausted, the molecular iodine survives. It binds with the starch indicator added to the mixture, creating the dramatic blue-black complex (Wikipedia).
The time you measure on the stopwatch is simply the time it takes for the sulphite to run out. The faster the reaction, the shorter the time.
Predicting the clock: what happens when you halve the concentration?
The iodine clock is typically a first-order reaction with respect to the main reactant (like potassium iodate) (Wikipedia). This means the rate of the reaction is directly proportional to its concentration.
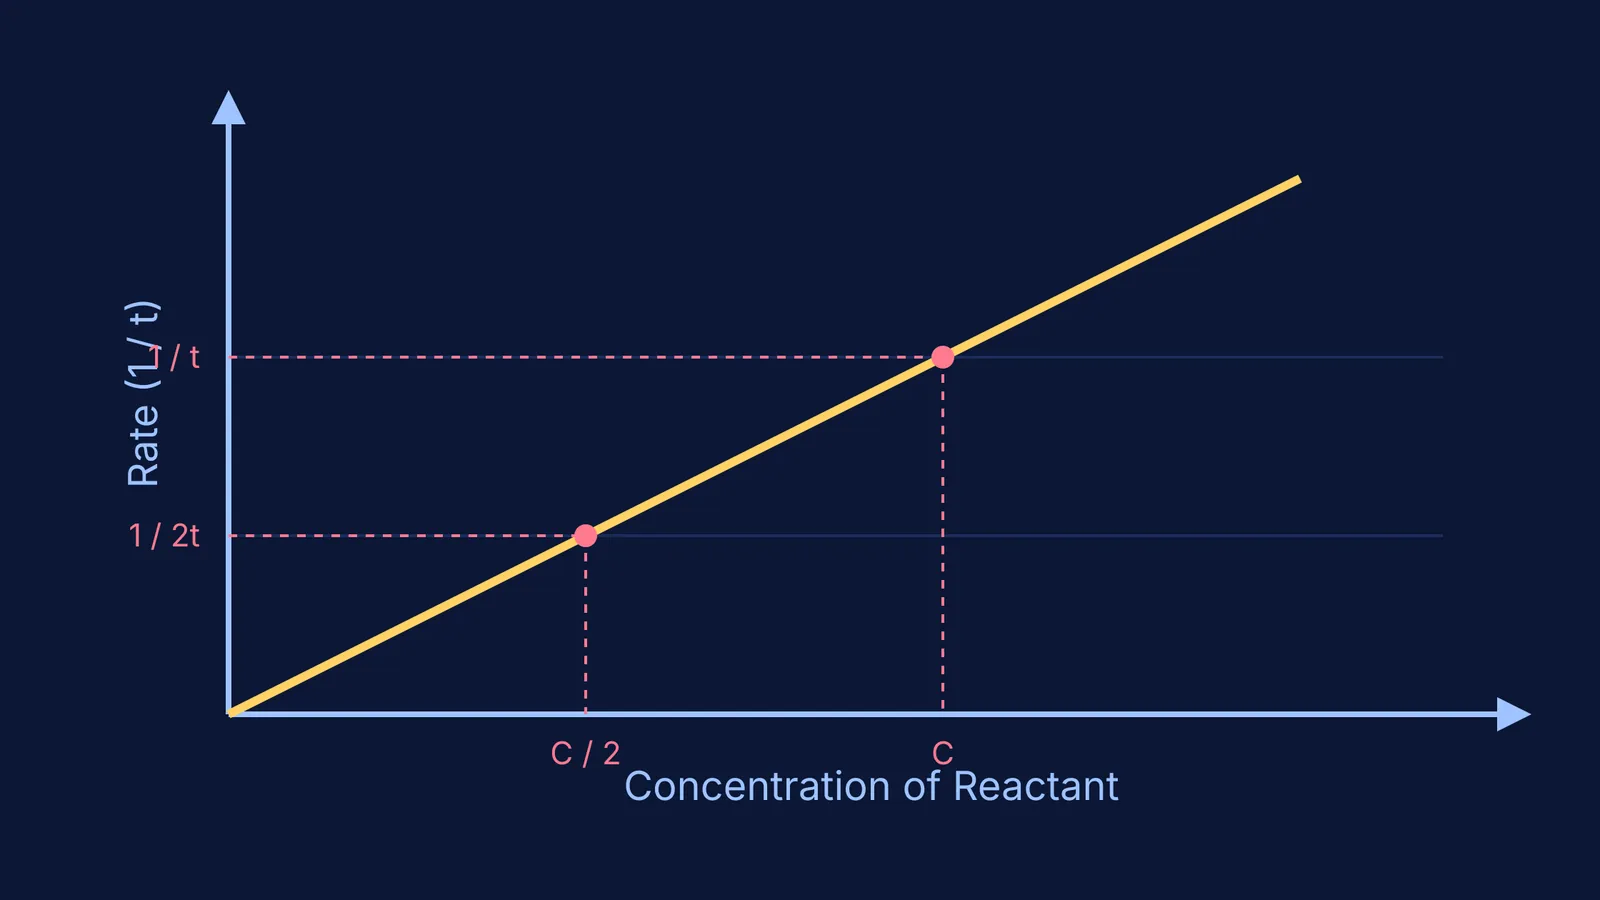
If you run an experiment and then repeat it after diluting the solution to exactly half its initial concentration, you cut the reaction rate in half. Because there are fewer reactant molecules in the same volume, they collide less frequently, meaning the slow step of the reaction takes longer to produce iodine.
Since the rate is slower, the overall reaction takes much longer to finish. Time and rate are inversely proportional in kinetics, just as they are in everyday life: if a car drives half as fast, the journey takes twice as long. Therefore, halving the concentration doubles the time it takes for the blue flash to appear. If your first mixture took a short amount of time to turn blue, the diluted mixture will take twice as long to reach the same endpoint.
Why do we plot 1/t instead of time?
When you run this experiment in the laboratory, you will record a series of times for several different concentrations of the reactant. If you plot the raw time (t) on the y-axis against concentration on the x-axis, you get a curve that slopes downwards. Curves are notoriously hard to read by eye, and they are even harder to use when you want to mathematically prove a direct, proportional relationship.
Instead, chemists simplify the analysis by approximating the initial rate of the reaction as 1/t. Because the amount of sulphite consumed is identical in every single trial, the speed of the reaction is simply a constant divided by the time it took.
If you plot 1/t on the y-axis and the concentration on the x-axis, the curve straightens out into a clear, diagonal line. For a first-order reaction, this straight line passes directly through the origin (0,0). This graph is the ultimate visual proof of the rate law: as you scale the concentration up, the rate (1/t) scales up by the exact same factor, proving the first-order dependence.
(To see how similar straight lines are used to prove other rate laws, read about Integrated rate law graphs: reading reaction order from straight lines).
How can you test the rate law with Fermi?
Visualising how invisible molecules dictate the hands of a stopwatch can be difficult. Instead of just memorising the 1/t rule, you can use the Fermi Simulation Lab to set up virtual clock reactions. You can halve the concentration yourself, predict the new timing, and watch the simulation to see if the blue flash happens when you expect it to.
If you get stuck on the calculations or find yourself confusing rate with time, Fermi's AI tutor can help. The tutor works out what you already know and builds a plan for the session. Rather than just giving you the answer, it writes on a virtual board to explain the kinetics step by step, ensuring you understand why the graph forms a straight line.
Kinetics isn't just about plugging numbers into formulas; it's about predicting how the physical world behaves. Once you know how to read the clock, you never look at a chemical reaction the same way again. (If you want to see how temperature affects this timing, check out our guide on the Temperature coefficient of reaction rate).


