

On this page
The greatest integer function, often called the floor function and written as [x] or ⌊x⌋, appears everywhere in mathematics. It looks simple—just round down—but it creates steps and jumps that can catch you out in exams.
What is the greatest integer function?
The rule for the greatest integer function is straightforward: it takes a real number x and returns the greatest integer that is less than or equal to x. According to its mathematical definition, this means rounding down to the nearest integer on the number line (Wikipedia).
If you feed it a positive decimal, it chops off the fraction. For example, [2.7] is 2, and [5.9] is 5.
If you feed it an integer, it leaves it alone: [4] is 4.
The trap lies in negative numbers. Because the function must return an integer less than or equal to the input, [−1.2] is not −1. On the number line, the integer immediately to the left of −1.2 is −2. So, [−1.2] = −2.
How do you predict the graph of [x]?
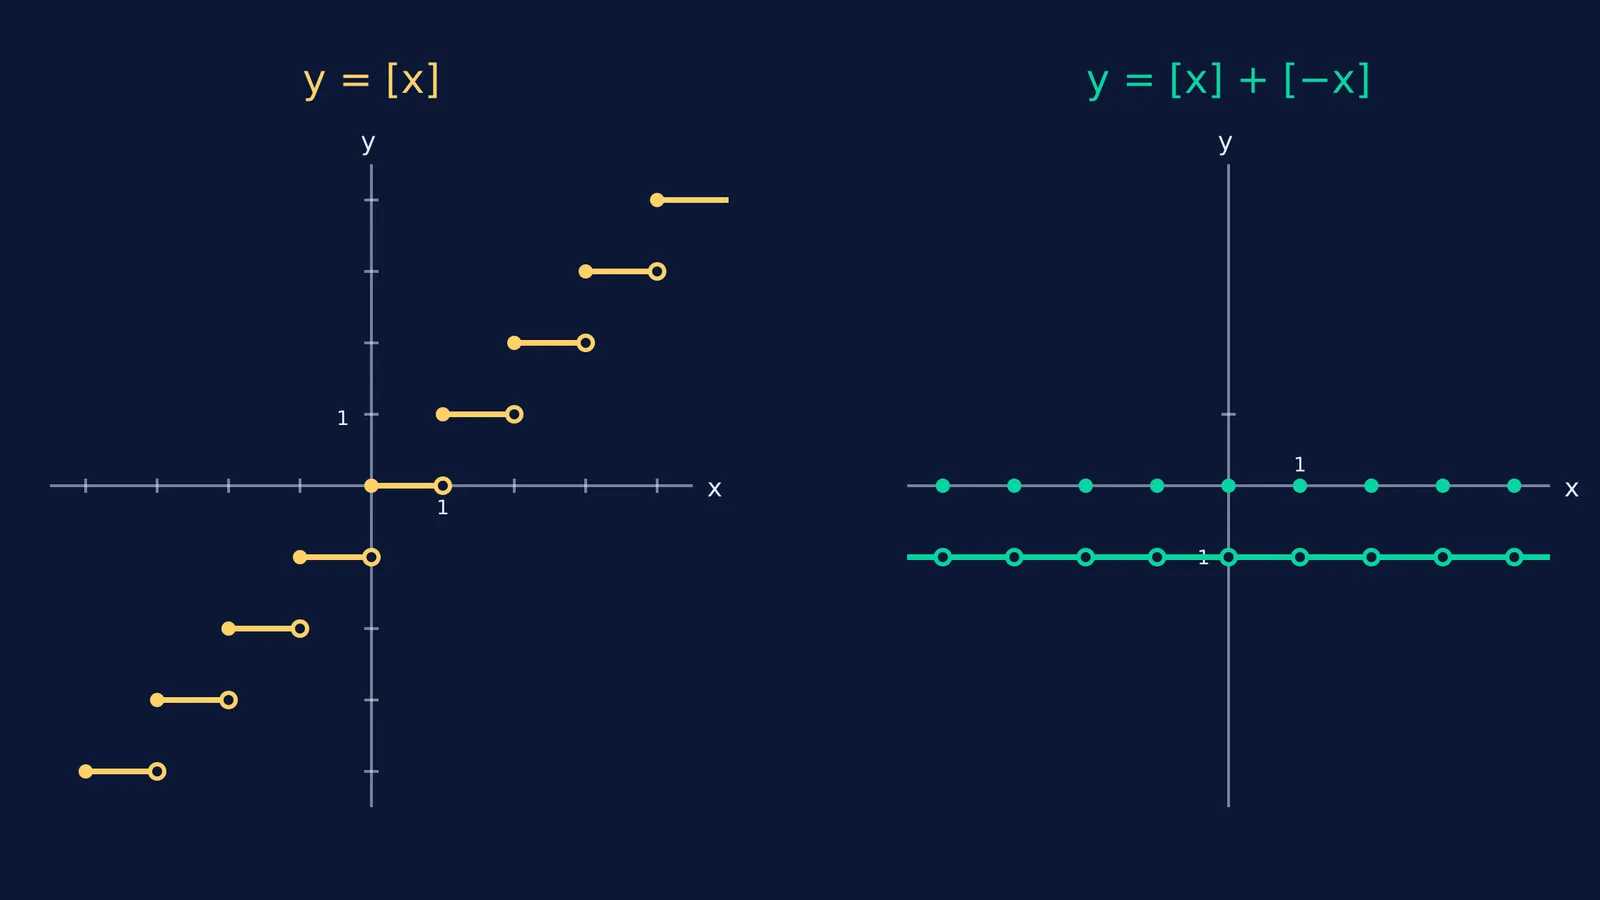
Because the output stays the same for a whole interval of numbers and then suddenly jumps, the graph of y = [x] looks like a staircase.
Take the interval from 0 up to, but not including, 1. Every number here (like 0.1, 0.5, 0.99) rounds down to 0. So, the graph is a flat horizontal line at y = 0.
At exactly x = 1, the value jumps to 1. Then it stays at y = 1 for all numbers up to 1.99.
At x = 2, it jumps to 2, and so on.
In mathematics, this sudden break in the curve is a discontinuity. If you are learning how to handle these breaks in calculus, it helps to review removable and jump discontinuities: telling them apart.
What does the graph of [x] + [−x] look like?
Exam papers for JEE and other entrance tests love to combine functions to see if you understand the underlying rules. A classic example is predicting the graph of y = [x] + [−x].
Instead of guessing, let us test some numbers.
Case 1: x is an integer
Pick x = 3.
[3] = 3.
[−3] = −3.
The sum is 3 + (−3) = 0.
This holds true for any integer. If x is an integer, [x] + [−x] is always 0.
Case 2: x is not an integer
Pick x = 2.4.
[2.4] = 2.
[−2.4] = −3 (remember, we round down to the left).
The sum is 2 + (−3) = −1.
What if x = −4.1?
[−4.1] = −5.
[−(−4.1)] = [4.1] = 4.
The sum is −5 + 4 = −1.
The rule is fixed: [x] + [−x] is exactly 0 when x is an integer, and exactly −1 when x is not an integer (Wikipedia).
If you plot this, you get a straight horizontal line at y = −1, but with a series of single-point holes punched out at every integer value of x. At those integer points, the graph spikes up to a single dot at y = 0.
If you find it hard to picture what happens to piecewise functions when you add or reflect them, you can build them in the Fermi Simulation Lab. Changing the function interactively lets you see exactly how the jumps shift and align.
Using this to solve equations
Knowing the shapes of these graphs saves you from doing long algebraic proofs. When an exam question asks you to solve an equation involving [x], your first step should be to check the intervals.
For example, if you see an equation mixing absolute values and greatest integer functions, you will often need to split the problem into cases (integers and non-integers). You can see a similar approach in our guide to equations and inequalities with modulus: the case-split method.
If you bring a problem set to Fermi's AI tutor, it checks your understanding as it goes and often draws the figure so you can see the jumps before you start solving. By understanding how [x] and [−x] step up and down, you can read the jumps straight off the graph instead of getting lost in the algebra.
The proof using the fractional part
If you want to be rigorous, you can prove why [x] + [−x] = −1 for non-integers using the fractional part of x.
Every real number x can be split into an integer part and a positive fractional part: x = n + f, where n is an integer and 0 < f < 1.
If we take the negative of x, we get −x = −n − f.
However, −f is a negative fraction (like −0.4). The greatest integer function requires a positive fractional part. We can rewrite −x by subtracting 1 and adding 1:
−x = (−n − 1) + (1 − f).
Now, (1 − f) is a positive fraction between 0 and 1. This means the integer part of −x is (−n − 1).
So, [−x] = −n − 1.
Add them together:
[x] + [−x] = n + (−n − 1) = −1.
This small algebraic trick confirms what the graph shows visually. Whether you are dealing with limits, integrals, or complex equations, knowing where the jumps happen is half the battle.


