

On this page
If you write out the Fibonacci sequence, you get a series of numbers that seem to grow out of control: 1, 1, 2, 3, 5, 8, 13, 21, 34, 55, 89, 144. Each term is simply the sum of the two before it. But hidden inside this simple addition rule is a famous pattern of division.
If you divide each number by the one before it, the answers start to zero in on a very specific value. You can try this yourself. Take a piece of paper, calculate the first few ratios, and predict what will happen next before reading on.
What is the Fibonacci sequence?
The Fibonacci sequence begins with 1 and 1. To find the next number, you add the two previous numbers together. So 1 + 1 = 2, then 1 + 2 = 3, then 2 + 3 = 5, and so on. The sequence appears in everything from Hemachandra's rules for counting the rhythms of Prakrit verse to the arrangement of leaves on a plant stem.
But what happens when we look at the relationship between these numbers? Instead of adding them, let us divide them.
How does the Fibonacci ratio converge?
If we take the ratio of consecutive terms—dividing each number by the one before it—we get a new sequence of fractions.
1 / 1 = 1.0
2 / 1 = 2.0
3 / 2 = 1.5
5 / 3 ≈ 1.667
8 / 5 = 1.6
13 / 8 = 1.625
21 / 13 ≈ 1.615
34 / 21 ≈ 1.619
55 / 34 ≈ 1.618
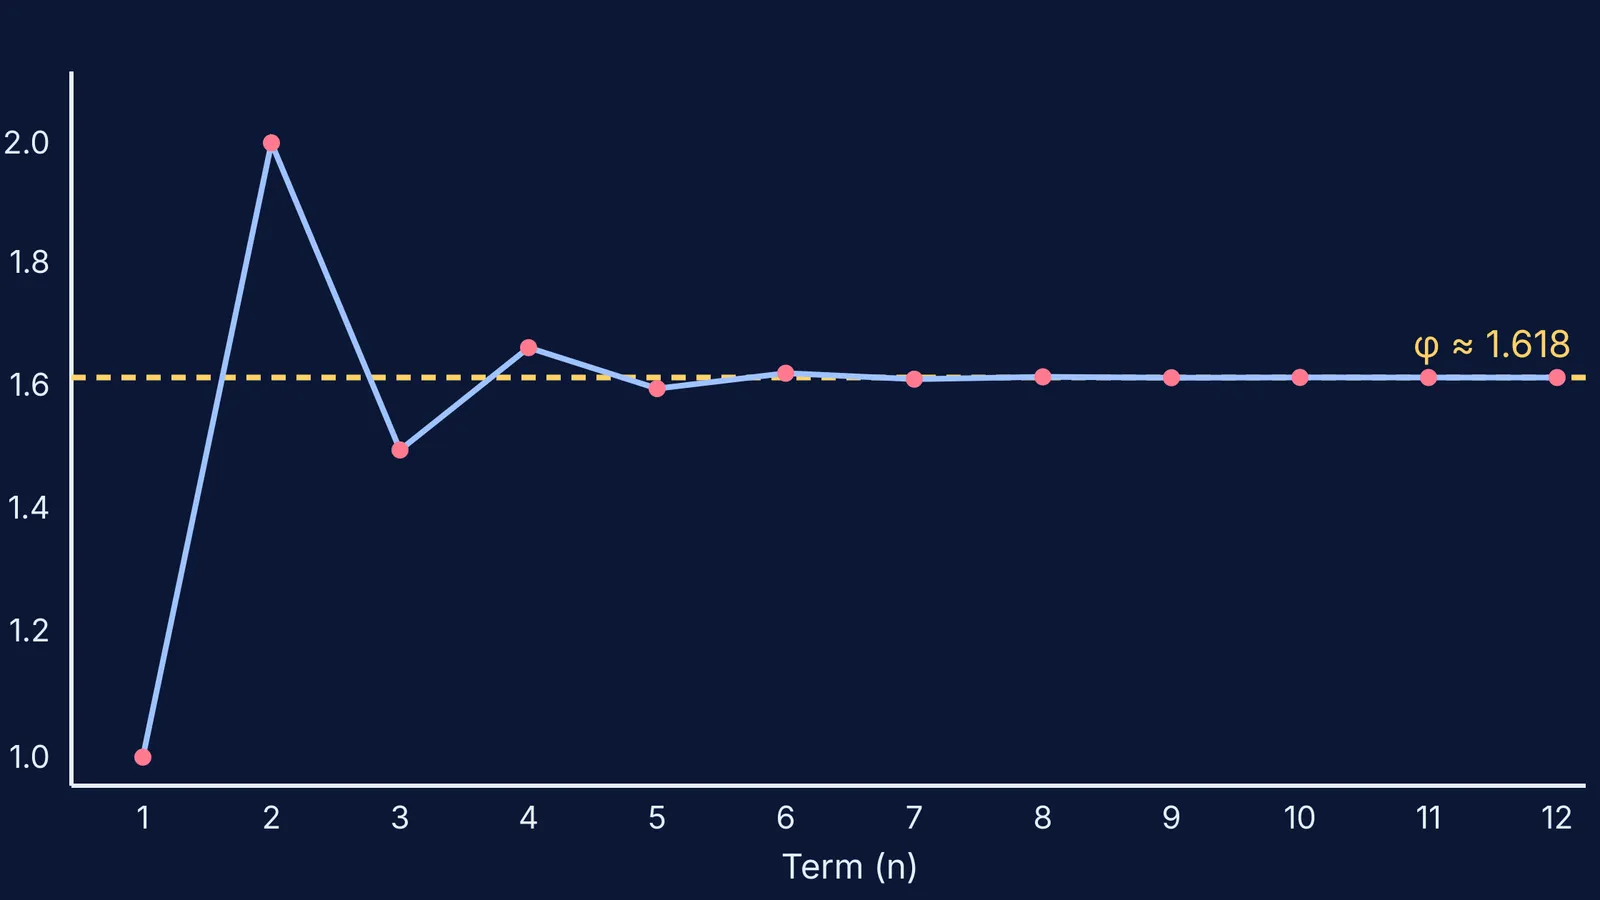
Notice what happens: the ratio jumps up and down, from 1.0 to 2.0, down to 1.5, up to 1.667. But with each step, the jumps get smaller. The sequence is homing in on a number.
Johannes Kepler observed that the ratio of consecutive Fibonacci numbers converges to the golden ratio (Wikipedia). The golden ratio, often denoted by the Greek letter phi (φ), is an irrational number approximately equal to 1.618034 (Wikipedia). If you were to draw these ratios on a graph, as shown in the diagram above, you would see the line oscillating around φ, getting closer and closer until it flattens out perfectly.
Why is predicting the ratio better for learning?
Earlier, we suggested you calculate the first few ratios and guess where they were heading. In learning science, this is known as the pre-testing effect. The pre-testing effect shows that attempting to answer questions about unknown material before studying leads to better subsequent learning performance (Wikipedia).
When you are working through mathematical patterns or population growth and cooling models, do not just read the textbook's conclusion. Pause and try to predict the result. It feels harder, and you will often be wrong, but the effort makes the true answer stick.
How to plot the Golden Ratio convergence
To see this convergence for yourself, you do not need complex tools. Here is a simple plan to visualise the mathematics:
Write the sequence: List the first 15 Fibonacci numbers.
Calculate the ratios: Divide each term by its predecessor (Fₙ₊₁ / Fₙ) and write down the decimals to three decimal places.
Set up your axes: On graph paper, draw a horizontal axis for the term number (n) and a vertical axis for the ratio, ranging from 1.0 to 2.0.
Draw the target line: Draw a straight horizontal line at roughly 1.618.
Plot the points: Mark your calculated ratios on the graph and connect them.
You will see the line zig-zag across the 1.618 mark, the swings growing narrower until they are too small to draw. If you find ideas like this easier to grasp when you can see them move, the Fermi Simulation Lab provides interactive simulations for ideas that are easier to see than to read, letting you change the starting numbers and watch the sequence find the golden ratio every time. Mathematics is not just about memorising formulas; it is about learning to spot the patterns hidden in plain sight.


