

On this page
An energy profile diagram has three things you can move: the reactant level, the product level and the peak between them. Once you know which question each one answers, most exam questions on this topic come down to reading heights. Below, you move one level, predict what changes, then check. The worked-example numbers are invented to keep the arithmetic clean.
What does an energy profile diagram show?
The horizontal axis is reaction progress: reactants on the left, products on the right. The vertical axis is energy, and for these questions that means enthalpy, H.
Activation energy is defined in OpenStax Chemistry 2e as "the minimum energy necessary to form a product during a collision between reactants".
The peak is the transition state, also called the activated complex. The same OpenStax section describes it as an unstable species formed when reactants collide with the right orientation and enough energy.
How do you tell exothermic from endothermic on the diagram?
Look only at the two flat ends and ignore the hump. ΔH is the product level minus the reactant level.
A negative ΔH means an exothermic reaction and a positive ΔH means an endothermic one, as stated in the OpenStax section on enthalpy.
Products lower than reactants: ΔH < 0, exothermic, heat is released.
Products higher than reactants: ΔH > 0, endothermic, heat is absorbed.
Move the product level and the sign of ΔH changes. Move the peak and it does not.
The peak's height is about how fast a reaction goes, not the sign of ΔH. If you want to calculate ΔH rather than read it off a diagram, our guide to Hess's law and thermochemistry shows how.
How do you find the activation energy each way?
Activation energy is always measured from where you start to the peak.
Forward Ea: from the reactant level up to the peak.
Reverse Ea: from the product level up to the same peak.
Both arrows end at the same point, so the difference between them is the gap between the two levels. That gives one line worth memorising: Ea(forward) minus Ea(reverse) equals ΔH. For an exothermic reaction the reverse barrier is always the taller one.
Worked example: what changes when you move one level?
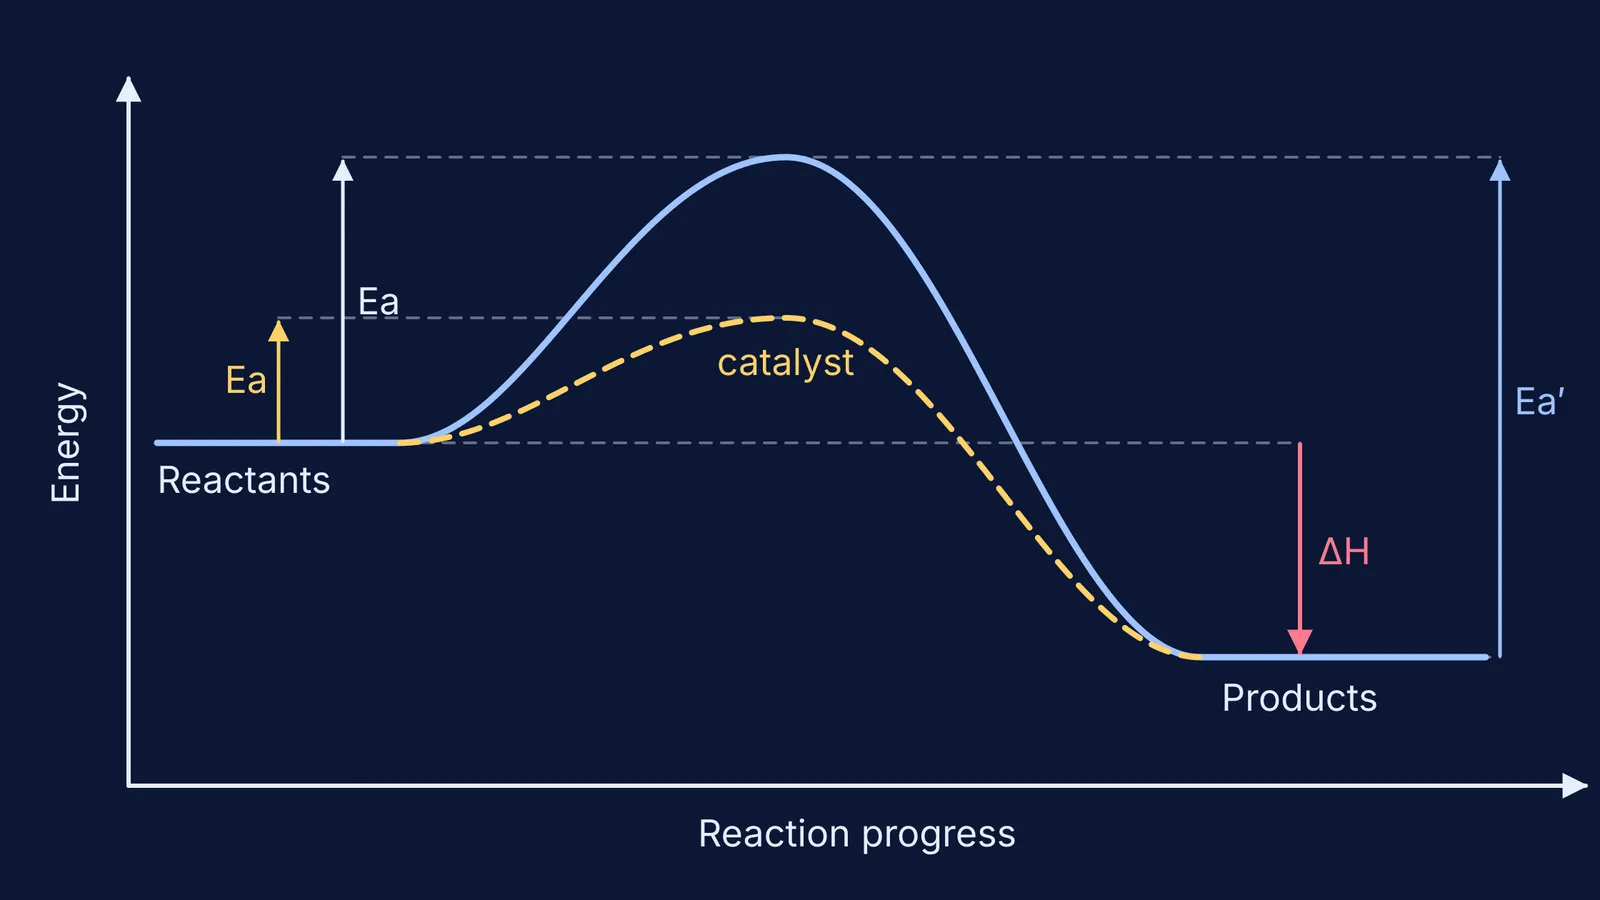
Set the reactants at 0 kJ/mol, the products at −60 kJ/mol and the peak at +80 kJ/mol. This is the diagram at the top of this post.
Read it. ΔH = −60 − 0 = −60 kJ/mol, so the reaction is exothermic. Forward Ea = 80 − 0 = 80 kJ/mol. Reverse Ea = 80 − (−60) = 140 kJ/mol. Check: 80 − 140 = −60, which equals ΔH.
Move the products up to +40 kJ/mol. Now ΔH = +40 kJ/mol, so the reaction is endothermic. Forward Ea is still 80 kJ/mol, and reverse Ea falls to 40 kJ/mol.
Put the products back at −60 and add a catalyst that brings the peak down to +35 kJ/mol. Forward Ea = 35 kJ/mol and reverse Ea = 95 kJ/mol. Both barriers dropped by the same 45 kJ/mol. ΔH is still −60 kJ/mol.
What does a catalyst change on an energy profile, and what does it not?
A catalyst gives the reaction a different pathway with a lower activation energy. In the OpenStax catalysis section, the catalysed and uncatalysed curves for the same reaction "begin and end at the same energies".
What a catalyst moves:
The peak, which comes down.
Forward Ea and reverse Ea, which fall by the same amount.
How fast the reaction reaches equilibrium.
What a catalyst does not move:
The reactant level or the product level.
ΔH, its size or its sign.
The equilibrium constant. A catalyst speeds up the forward and reverse reactions so equilibrium is reached sooner, "but without a change in the equilibrium constant", according to OpenStax on shifting equilibria.
For why a lower barrier means more successful collisions each second, see our explainer on collision theory and catalysts.
Why do students misread these diagrams?
In a 2018 study in Chemistry Education Research and Practice, Lamichhane and colleagues coded the written rationales of 223 undergraduate students who answered a multiple-choice question on energy diagrams, and interviewed 10 of them. They reported alternate conceptions about energy diagrams that had not been described in the literature before.
Our suggestion is the worked example's method: change one feature, predict, check. A picture you can move makes it harder to confuse "how high is the hump" with "how far apart are the ends". We compare the two formats in simulations versus static diagrams.
For other ideas that are easier to see than to read, the Fermi Simulation Lab has interactive simulations. Whichever you use, move one thing at a time and predict before you look.


