

On this page
If you travel between southern and northern India during the solstices, daylight hours change dramatically. In late June, dusk arrives early in Chennai, while Srinagar enjoys long summer evenings. By late December, Srinagar plunges into darkness by late afternoon, while Chennai sees little seasonal change. Most students know seasons stem from Earth's tilted axis, but few can predict the daylight gap between two cities before testing it in a model.
Why does day length vary across different latitudes?
Earth rotates on an axis tilted at 23.44° relative to its orbital plane (OpenStax Astronomy). As our planet orbits the Sun, this fixed tilt points the Northern Hemisphere sunward in June and away in December. Misconceptions often attribute seasons to orbital distance, but OpenStax notes Earth's distance varies by only 3%, and our planet is closest to the Sun in January.
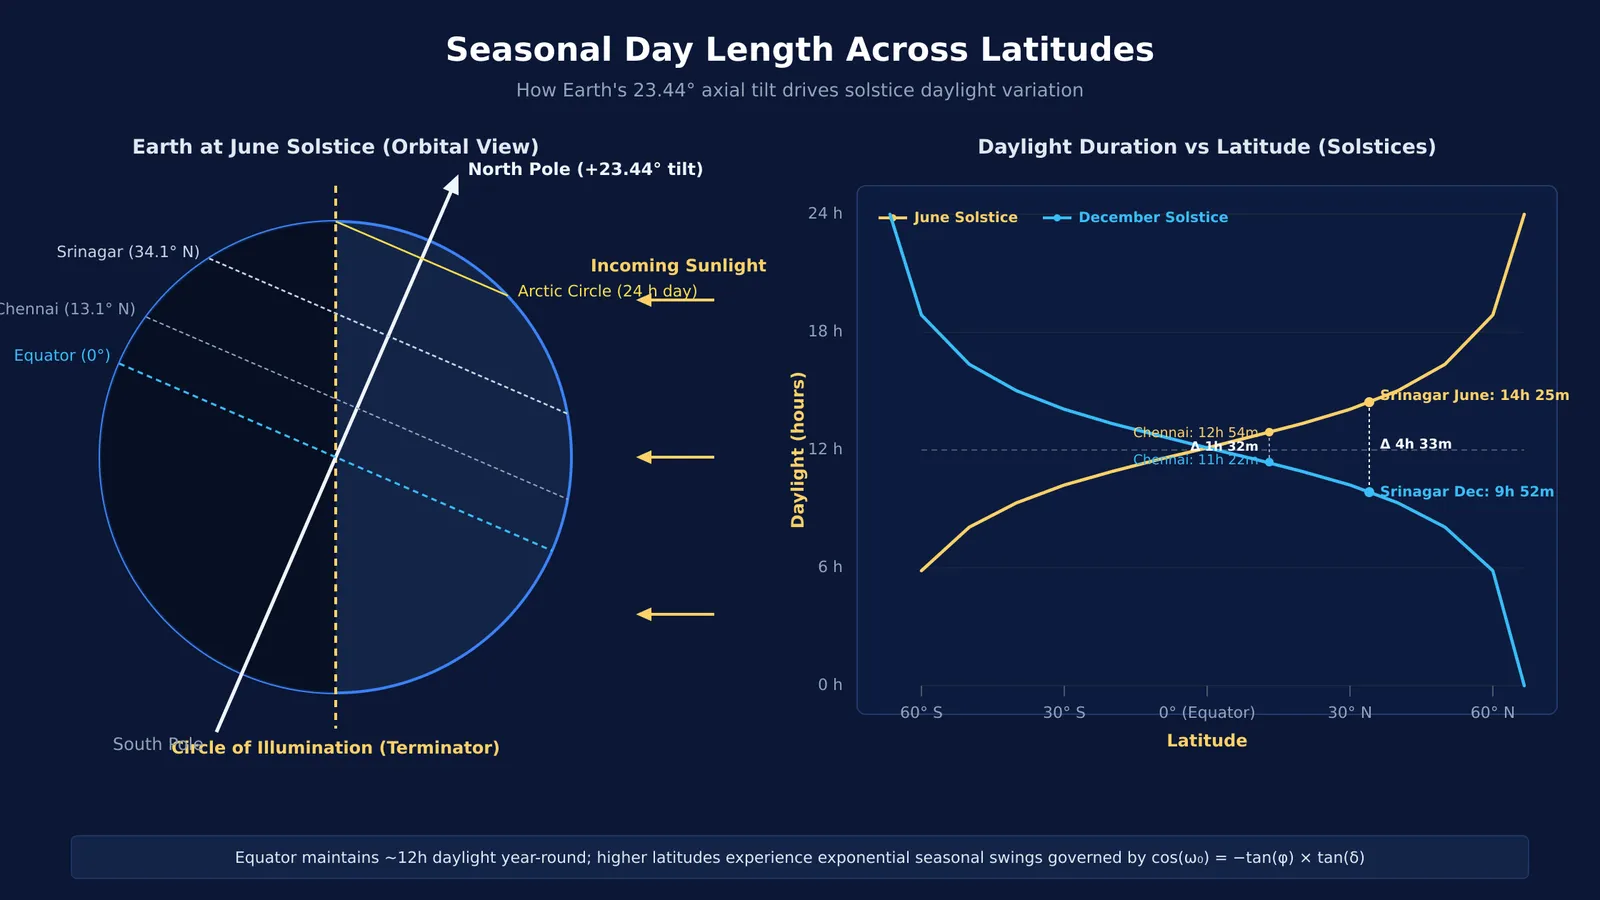
Daylight changes because Earth's circle of illumination—the boundary dividing day from night—cuts parallels of latitude at varying angles. Near the Equator, it splits every parallel nearly in half year-round. Toward the poles, the tilt divides parallels into unequal day and night arcs. You can explore why seasons and daylight hours change across the globe to see how orbital geometry drives this pattern.
What happens in Chennai versus Srinagar during the solstices?
To see how latitude scales this effect, compare two Indian cities separated by 21 degrees of latitude: Chennai (13.08° N) and Srinagar (34.08° N), tracked by Time and Date.
Summer solstice (June 21): Chennai receives 12 hours 54 minutes of daylight (sunrise 5:44 AM, sunset 6:38 PM) in Time and Date records. Solar data for Srinagar shows 14 hours 25 minutes (sunrise 5:20 AM, sunset 7:45 PM)—giving Srinagar 91 extra minutes of light.
Winter solstice (December 21): The pattern flips. Chennai shortens to 11 hours 22 minutes (Time and Date), while Srinagar contracts to 9 hours 52 minutes (Time and Date).
Across the year, Chennai experiences a seasonal swing of 1 hour 32 minutes (92 minutes), as recorded in Time and Date solar data. In contrast, Srinagar experiences a swing of 4 hours 33 minutes (273 minutes)—nearly three times as large.
How does spherical geometry calculate day length?
Astronomers calculate day length using spherical trigonometry. According to the NOAA Global Monitoring Laboratory, the sunrise hour angle ω₀—the angular distance Earth rotates from solar noon to sunrise—satisfies:
cos(ω₀) = −tan(φ) × tan(δ)
Here, φ is observer latitude and δ is solar declination (+23.44° in June, −23.44° in December, per NOAA). Because Earth turns 15° per hour, geometric day length equals 2 × ω₀ / 15°.
To apply this for Srinagar (φ = 34.08° N) in June (δ = +23.44°):
Find the hour angle: Multiplying tan(34.08°) ≈ 0.6766 by tan(23.44°) ≈ 0.4336 yields 0.2933; arccos(−0.2933) gives ω₀ ≈ 107.06°.
Convert to geometric hours: Dividing 2 × 107.06° by 15° per hour gives 14.27 hours (14 hours 16 minutes).
Add atmospheric refraction: Adding 50 arcminutes (0.833°) for refraction and solar semidiameter shifts the sunrise zenith angle to 90.833°, yielding 14 hours 25 minutes (NOAA).
The tan(φ) factor amplifies daylight swings. Near the Equator, tan(φ) stays near zero, keeping days at roughly 12 hours. At higher latitudes, tan(φ) grows rapidly, widening the seasonal swing.
How can you test your predictions in an interactive simulation?
Calculating formulas on paper confirms the math, but dynamic models build spatial intuition. In their study of physics learning, Gunstone and White (1981) introduced the Predict-Observe-Explain protocol, showing that predicting an outcome before observing it helps learners confront misconceptions.
You can use the Fermi Simulation Lab to test day length interactively in three steps:
Predict: Before adjusting controls, estimate daylight hours for Chennai and Srinagar in June and December. Consider whether hotter summer cities always have longer days.
Observe: In the simulation, set latitude to 13.1° N for Chennai and 34.1° N for Srinagar. Move the date slider between solstices to watch how the terminator cuts each parallel.
Explain: Compare your predictions with the readouts to see how latitude amplifies seasonal swings.
If you want to work through the math behind the curve, Fermi's AI tutor holds a line of reasoning across a session to help derive the hour angle equation step by step, drawing figures and checking understanding as you go.
What does active learning reveal about common astronomy misconceptions?
Astronomy concepts often feel counterintuitive because we view the sky from a rotating, tilted surface. As OpenStax Astronomy explains, solar angle and daylight duration together determine seasonal temperatures. Research on active learning through guided inquiry shows that interactive tools replace memorisation with mental models. While static diagrams depict Earth from outside, interactive simulations reveal dynamic relationships directly.
When testing daylight variations, keep three principles in mind:
Latitude controls amplitude, declination controls timing: Latitude sets the width of a location's seasonal swing; orbital position sets current solar declination along that curve.
Equinoxes are universal equalisers: When declination δ equals 0° in March and September, tan(δ) = 0, producing roughly 12 hours of light everywhere on Earth (OpenStax Astronomy).
Heat lags behind daylight: Srinagar receives longer daylight than Chennai in June, but Chennai remains hotter because its higher solar altitude delivers concentrated radiation rather than slanting rays.
Testing these relationships through active prediction turns an abstract geography formula into an enduring mental model of how our planet moves through space.


