

On this page
"Students who sleep more score higher." You have probably heard this from a teacher, a parent or a topper interview. But a pattern in data and a cause are different things, and telling them apart helps you judge every study-habit claim, from "toppers wake at 5 am" to "flashcards get better ranks".
What is the difference between correlation and causation?
A correlation means two measurements tend to rise or fall together. Causation means that changing one would change the other. The strength of a straight-line pattern is usually measured with Pearson's coefficient r, which runs from −1 to +1 (how r is calculated, with a worked example).
Sleep and grades are a real correlation. In a 2019 study in npj Science of Learning, 88 students in an introductory college chemistry class wore activity trackers. Longer, better-quality and more consistent sleep went with better grades, and sleep measures accounted for nearly 25% of the variance in performance. Sleep on the single night before a test showed no relation to that test's score; sleep over the previous week and month did. The study's title says sleep is "associated with" better performance: an association, not proof of cause.
Why might students who sleep more score higher without sleep being the cause?
Before you accept "sleep causes marks", rule out three other explanations:
A confounder. A third factor drives both. A student with a long daily commute may sleep less and also have less time to revise.
Reverse causation. A student who is on top of the syllabus has no reason to stay up cramming, so being prepared can lead to more sleep.
Chance. In a small group, patterns appear by luck. A link you spot among a handful of friends may vanish across a whole school.
A classic warning appeared in 2012, when a note in the New England Journal of Medicine reported that across 23 countries, chocolate eaten per person correlated with Nobel laureates per 10 million people at r = 0.791 (summary in PubMed Central). Its author, Franz Messerli, wrote that the findings were "hypothesis-generating only" (NEJM CardioExchange). A strong r tells you two things move together, not why; national wealth is one obvious third factor to check.
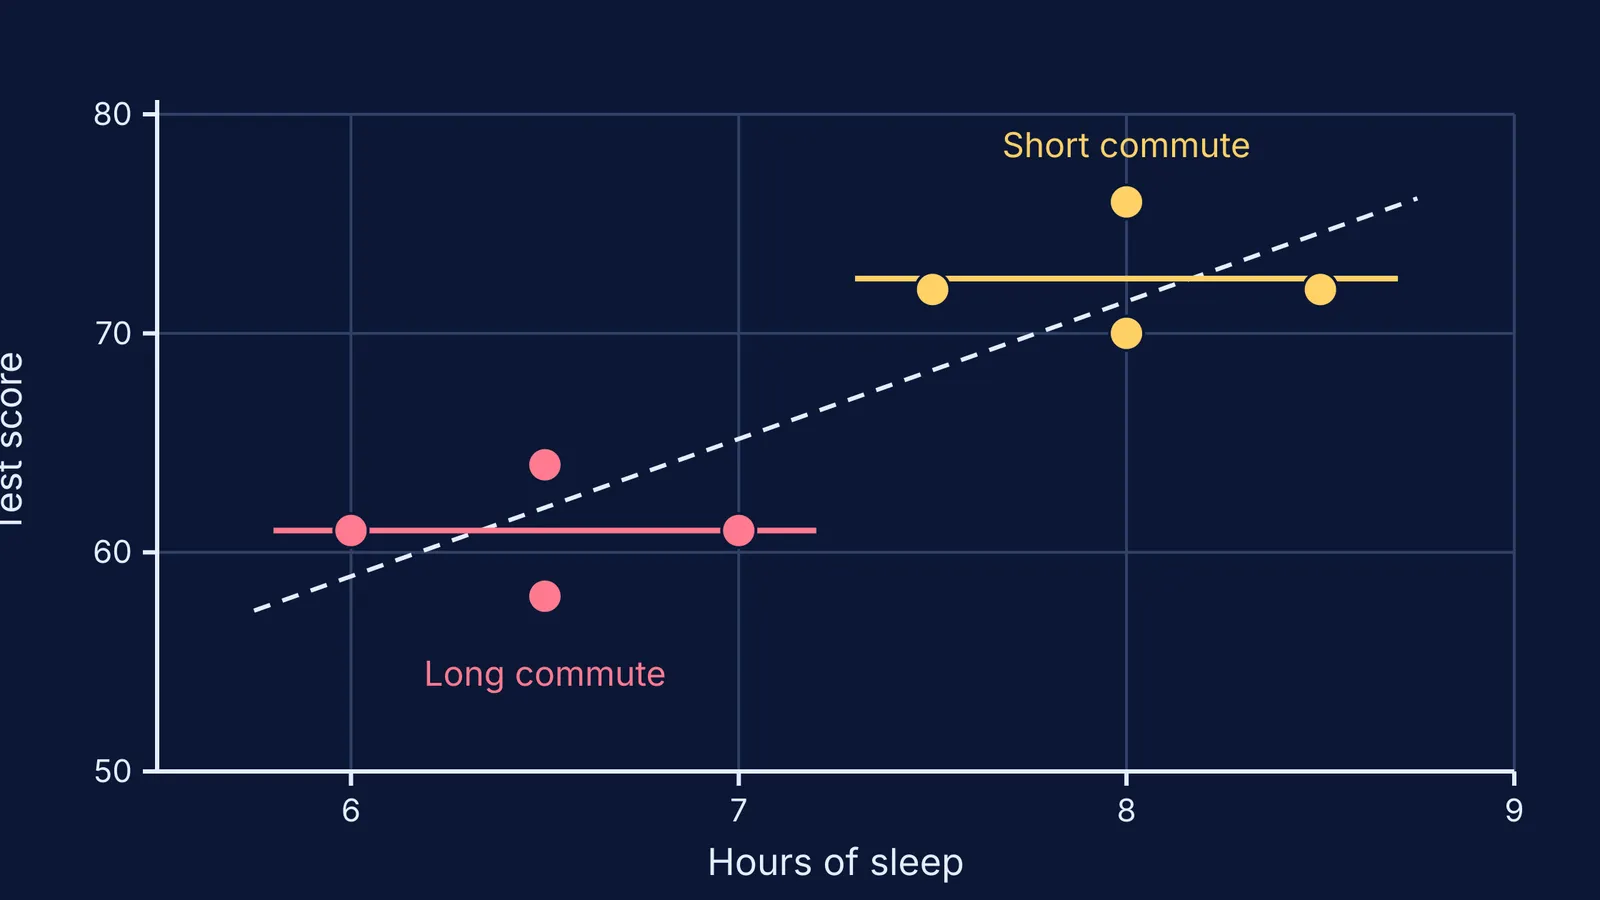
Try it: can you find the confounder in this scatter plot?
Here are eight invented students: hours of sleep, then a test score out of 100.
Asha: 7.5 hours, 72 (short commute)
Rohan: 8 hours, 70 (short commute)
Meera: 8 hours, 76 (short commute)
Kabir: 8.5 hours, 72 (short commute)
Ishaan: 6 hours, 61 (long commute)
Priya: 6.5 hours, 58 (long commute)
Arjun: 6.5 hours, 64 (long commute)
Sana: 7 hours, 61 (long commute)
Plot all eight points: sleep on the x-axis from 5.5 to 9 hours, score on the y-axis from 50 to 80.
Draw a best-fit line by eye. It slopes clearly upward; we calculated r = 0.85.
Now colour the short-commute and long-commute students differently.
Look inside each colour. Within each group, more sleep does not go with a higher score: r is exactly 0 for both.
The whole upward trend came from the gap between the two groups. In this made-up class, commute is the confounder: it cuts sleep and marks at the same time.
How do researchers test whether sleep really causes better grades?
The strongest test is to change one thing on purpose and hold the rest steady. Seattle's public high schools came close in fall 2016, moving the school start from 7:50 to 8:45 am (ScienceDaily report). Researchers had sophomores at two schools wear wrist activity monitors, comparing a class studied in spring 2016, before the change, with a different class in spring 2017 (Dunster and colleagues, Science Advances, 2018). Median sleep rose by 34 minutes, and median grades were 4.5% higher.
That is stronger than a plain correlation, because the school changed the clock rather than students choosing their sleep. Even so, the authors write that "it is much harder to attribute causality for 4.5% higher grades on increased sleep", partly because the two years had different students. Controls can shrink famous results too: see what the 2018 marshmallow test replication found.
Physics is the easier case, because you can change one quantity and hold everything else fixed. The Fermi Simulation Lab has interactive simulations for the ideas that are easier to see than to read, a good place to practise the habit behind every fair experiment: one variable at a time.
Five questions to ask before you believe a study-habit claim
Did anyone change something on purpose, or only observe?
What third factor could drive both things?
Could the arrow point backwards?
How many people were studied, and has it been repeated?
Do the authors say "associated with" or "causes"?
Run the same five questions over your own mock test data before deciding what to change.


