On this page
Put two species in one jar with one kind of food and, sooner or later, one usually disappears. Ecologists call this competitive exclusion, and a few lines of maths let you predict it. Then change how much the two species overlap in what they eat, and find the point where both survive.
What happens when two species compete for the same food?
Gause's competitive exclusion principle states that two closely related species competing for the same resources cannot coexist indefinitely, and the competitively inferior one is eventually eliminated, as the NCERT Class 12 Biology chapter Organisms and Populations puts it. The same chapter adds a caveat worth remembering for exams: this may be true if resources are limiting, but not otherwise.
The classic evidence is Georgy Gause's 1930s Paramecium cultures. Grown separately, P. aurelia and P. caudatum both thrive; in the same tube, P. aurelia outcompetes P. caudatum for food until the latter dies out, as OpenStax Biology 2e describes. A 2020 paper in Ecology and Evolution gathered 42 datasets from Gause's experiments and related work into a free R package and found that, in most cases, a simple Lotka–Volterra model accurately describes the dynamics (Mühlbauer and colleagues, 2020).
For a field case, NCERT notes that the Abingdon tortoise of the Galapagos became extinct within a decade after goats were introduced, apparently because the goats browsed more efficiently.
How does a simulation predict which species wins?
A standard two-species competition simulation runs the Lotka–Volterra competition equations. They add one term to the logistic growth equation dN/dt = rN(K − N)/K from NCERT and our story of Pierre Verhulst and the logistic curve. For species A:
dA/dt = r × A × (K_A − A − α × B) / K_A
Here K_A is the carrying capacity of A, and α (alpha) says how much one B individual eats into the food of A, counted in A-individuals. If both eat exactly the same food, α = 1. If they barely overlap, α is close to 0. Species B has a matching equation with its own K_B and α.
Predict the ending before you press play with the invasion test: let one species fill the habitat to its carrying capacity, then ask whether a few of the other can still grow. B can grow when rare if K_B is bigger than α × K_A.
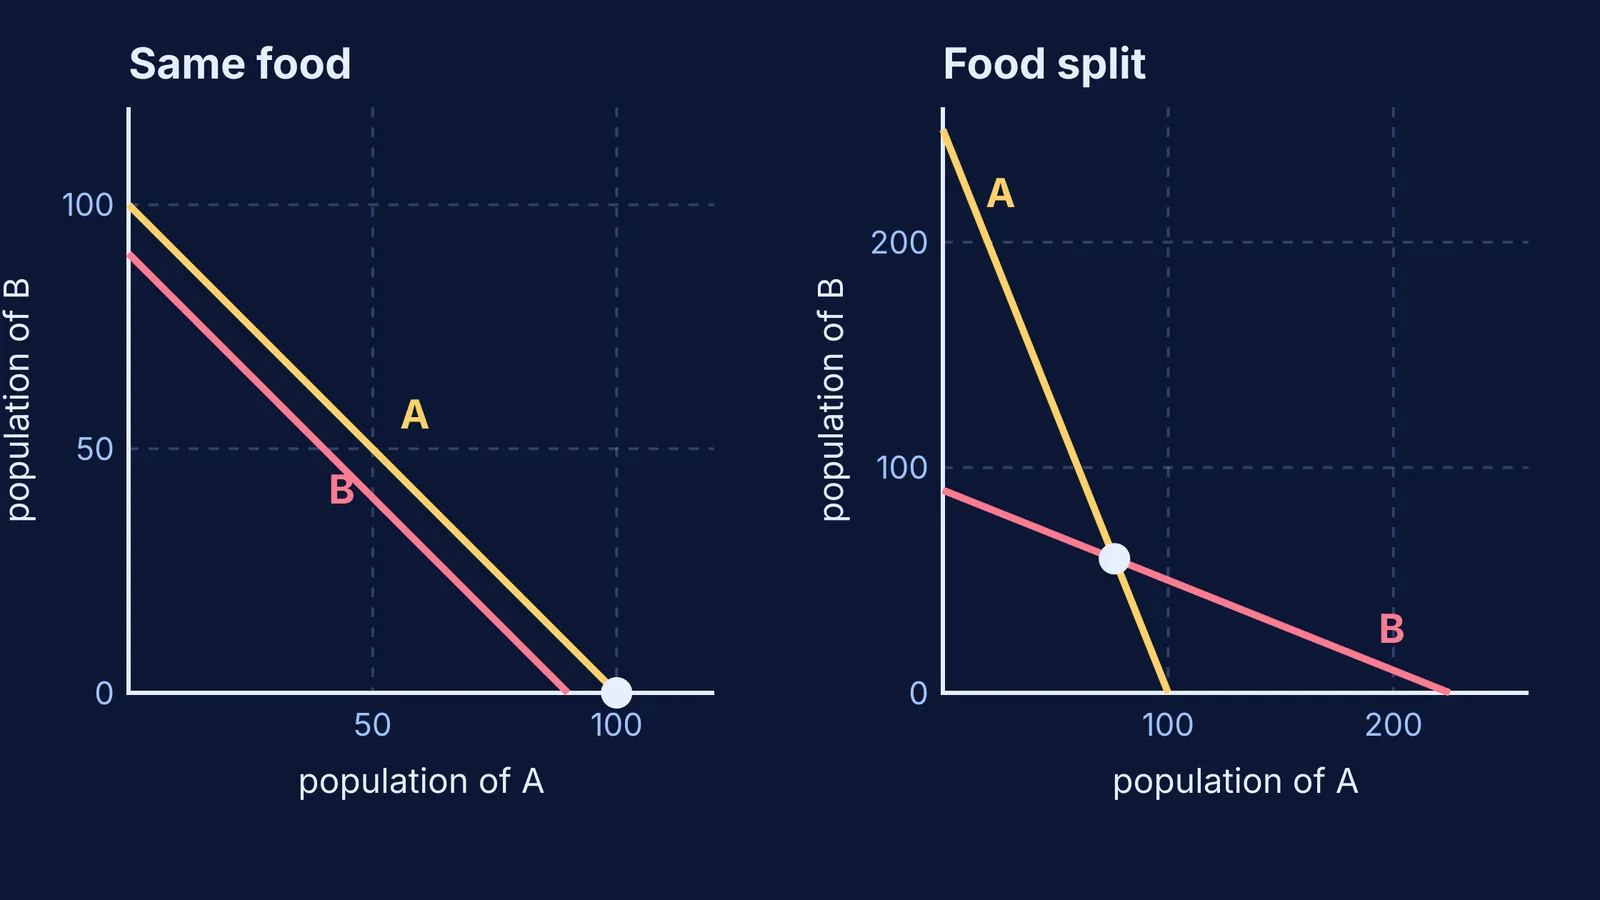
Worked example, same food: set K_A = 100, K_B = 90, start both at 5 with the same growth rate, and set α = 1 both ways.
Can B invade A? Is 90 bigger than 1 × 100? No.
Can A invade B? Is 100 bigger than 1 × 90? Yes.
Prediction: A wins. Both rise at first while food is plentiful, then B shrinks towards zero and A settles at 100.
How can splitting resources let both species survive?
Resource partitioning means competing species avoid competition by, for instance, choosing different times for feeding or different foraging patterns, according to NCERT. Its example: Robert MacArthur showed that five closely related warbler species living on the same tree coexist through behavioural differences in foraging.
MacArthur published the study in Ecology in 1958, after dividing conifer trees into zones and recording where each bird fed. A Stanford Birds essay on MacArthur's warblers describes the Cape May warbler feeding mostly near the outside top, the Bay-breasted mostly around the middle interior. For the bigger idea, read about G. Evelyn Hutchinson and the ecological niche.
In the model, partitioning simply means a smaller α. Rerun the example with α = 0.4:
Can B invade A? Is 90 bigger than 0.4 × 100 = 40? Yes.
Can A invade B? Is 100 bigger than 0.4 × 90 = 36? Yes.
Prediction: both survive. Solving for zero growth gives A ≈ 76 and B ≈ 60, each below its carrying capacity because each still eats some of the other's food.
How do you run this experiment yourself?
Write down a prediction before every run.
Note K_A, K_B and both values of α, and predict the winner with the invasion test.
Run full overlap and check your predicted winner.
Lower α in steps of 0.1 and record the first value where both survive.
Give B the bigger carrying capacity and see whether the winner switches.
Make α unequal, so A harms B more than B harms A, and predict again.
The model assumes a closed, well-mixed habitat, and NCERT notes that evidence for competitive exclusion in nature is not always conclusive. A simulation sharpens your predictions; it does not prove them.
If you would rather see curves move than solve equations, the Fermi Simulation Lab has interactive simulations for ideas that are easier to see than to read. If logistic growth itself feels shaky, each idea has its own lesson in the Fermi Concept Library.
For the rest of the syllabus chapter, see our guide to organisms and populations: growth models and species interactions.