

On this page
Imagine a physics test scored out of 100. Most students scored between 40 and 60, but one student managed to score a 98. If you look at the class average, that single high mark pulls the entire mean upwards, making the class look like they did better overall than they actually did.
This is where the box plot comes in. Instead of letting one extreme value distort the picture, a box plot focuses on where the bulk of the crowd sits. It relies on quartiles—markers that split the data into four equal groups—to give you a stable view of the results.
How do quartiles handle extreme scores?
When you add a very high or very low mark to a dataset, the mean gets dragged toward it. However, the median (the middle value) and the quartiles barely budge.
The central box in a box plot spans from the first quartile (Q1, the 25th percentile) to the third quartile (Q3, the 75th percentile). According to the JMP Statistics Knowledge Portal, the length of this box is called the interquartile range (IQR). Because the IQR only tracks the middle half of the data, an extreme score of 98 sitting at the far end of the number line is left out of the calculation.
This resistance is why statisticians prefer John Tukey and the box plot over simple averages when looking at skewed data. Tukey introduced the plot in his 1977 book *Exploratory Data Analysis* specifically to let researchers see the true shape of their data before running tests.
What does the 1.5 IQR rule actually do?
A box plot does not just ignore extreme marks; it identifies them and labels them. It does this using a mathematical boundary called a fence.
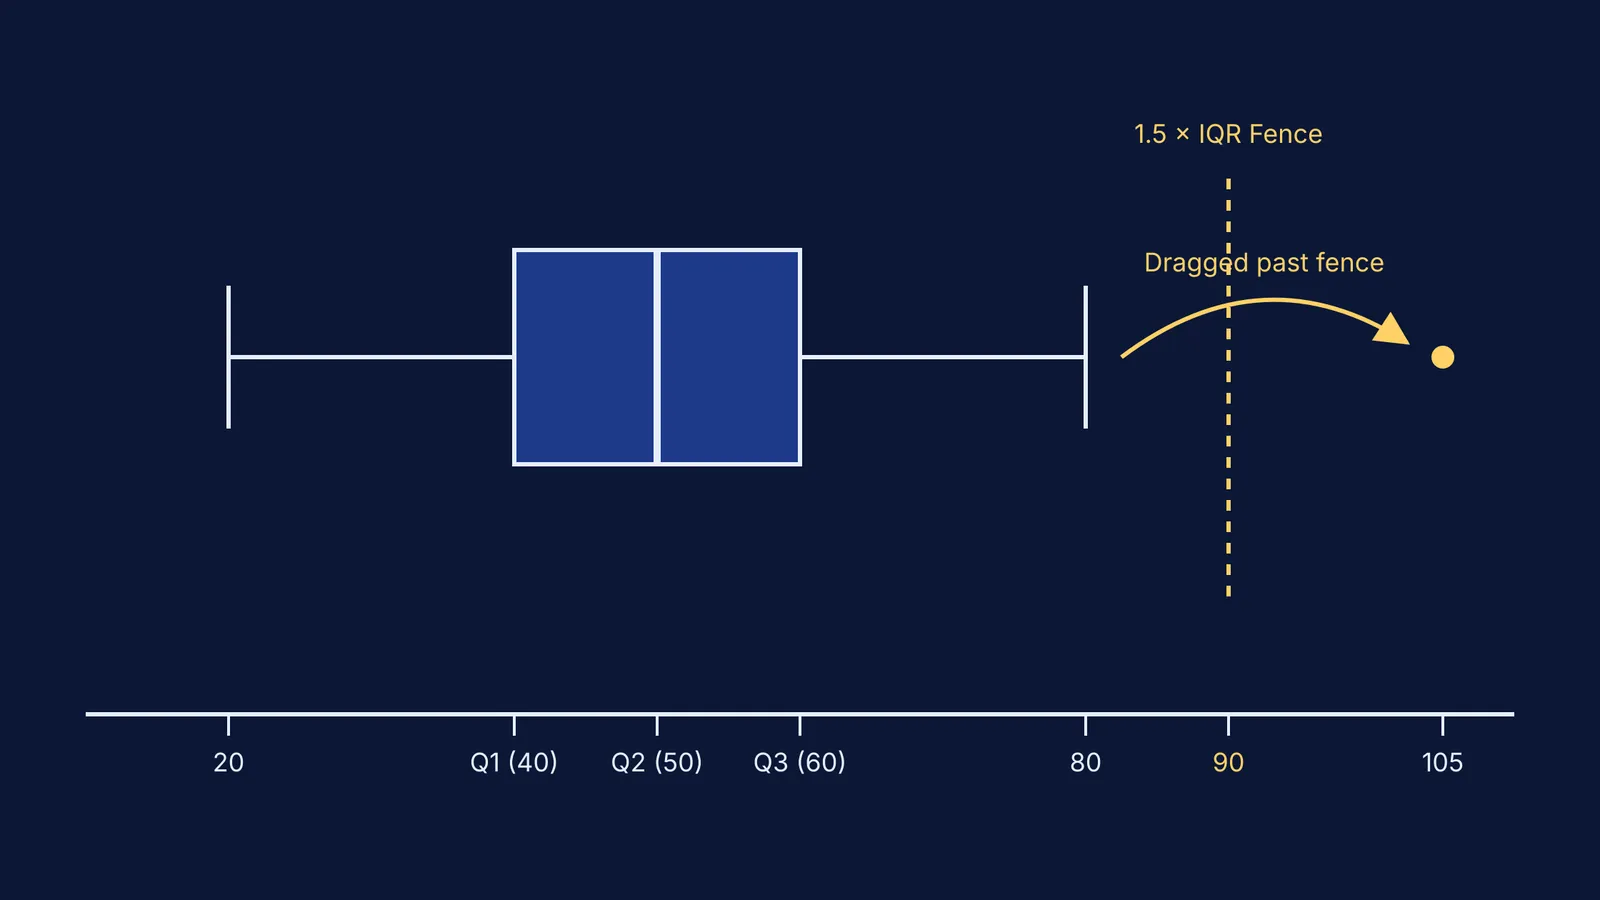
Any data point that sits too far away from the box is flagged as an outlier and plotted as an individual dot. The standard rule, as detailed by JMP, is to multiply your IQR by 1.5. You then subtract that number from Q1 to set your lower fence, and add it to Q3 to set your upper fence.
The lines that reach out from the box—the whiskers—extend only up to 1.5 times the IQR from the edges of the box. If a data point lands outside that invisible boundary, the whisker stops at the last normal value. The extreme point is then left stranded as an outlier dot. This makes anomalies visually obvious without letting them skew the visual weight of the central box.
How can you predict the shift with an interactive point?
Reading about quartiles on a whiteboard is one thing, but seeing them react is much clearer. If you use the Fermi Simulation Lab, you can drag a single data point along an axis and watch what happens to the box plot in real time.
Here is exactly what you will notice if you try this experiment:
Dragging within the box: If you slide a point around inside the middle half, the median line might tick slightly to the left or right, but the width of the box stays mostly the same.
Dragging down the whisker: As you pull the point away from the box, the whisker stretches to follow it. The IQR and the median remain stable.
Breaking the fence: Once you drag the point past the 1.5 IQR boundary, the whisker abruptly snaps back to the next highest value inside the fence. Your dragged point turns into a lone outlier dot, completely detached from the rest of the shape.
Watching the mean: If your simulation also tracks the average with an "x" on the plot, you will see the mean marker chase your dragged point indefinitely. It will eventually leave the box entirely, even though the mean absolute deviation about the median shows the main crowd has not shifted at all.
How can you test this with your own exam data?
If you are looking at a set of exam scores and spot an unusually high or low mark, use this quick mental checklist to predict how it affects your statistics. Ask yourself these three questions:
Does the new score move the mean? Yes, significantly. A single 100 in a sea of 40s will pull the average up immediately.
Does it stretch the IQR? No. The middle half stays anchored exactly where it was. The box retains its original width.
Does it stretch the whisker? Only up to a specific limit. If the mark is higher than Q3 plus 1.5 times the IQR, it becomes an outlier and the whisker retreats to the next highest mark.
Understanding this mathematical behaviour stops you from being fooled by an average that is being artificially propped up by one or two extreme performances. When you evaluate your own study habits or test scores, focusing on the median and the interquartile range gives you a much more honest assessment of your typical performance.


