

On this page
Picture a hydrogen atom on your screen and a slider that sets a photon's energy. You fire, and one of three things happens: the electron jumps up, the photon passes through, or the electron is knocked out. A Bohr model simulation tests whether you can predict which one before you click.
What does a Bohr model simulation of hydrogen show?
Niels Bohr set out the model in his 1913 paper On the constitution of atoms and molecules. The electron in hydrogen can move only in certain allowed orbits, and it gives out or takes in light only when it jumps from one to another.
The simulation turns that into one rule: the atom absorbs a photon only if the photon's energy equals the difference between two allowed levels. Any other photon goes straight through.
Why are only certain energies allowed?
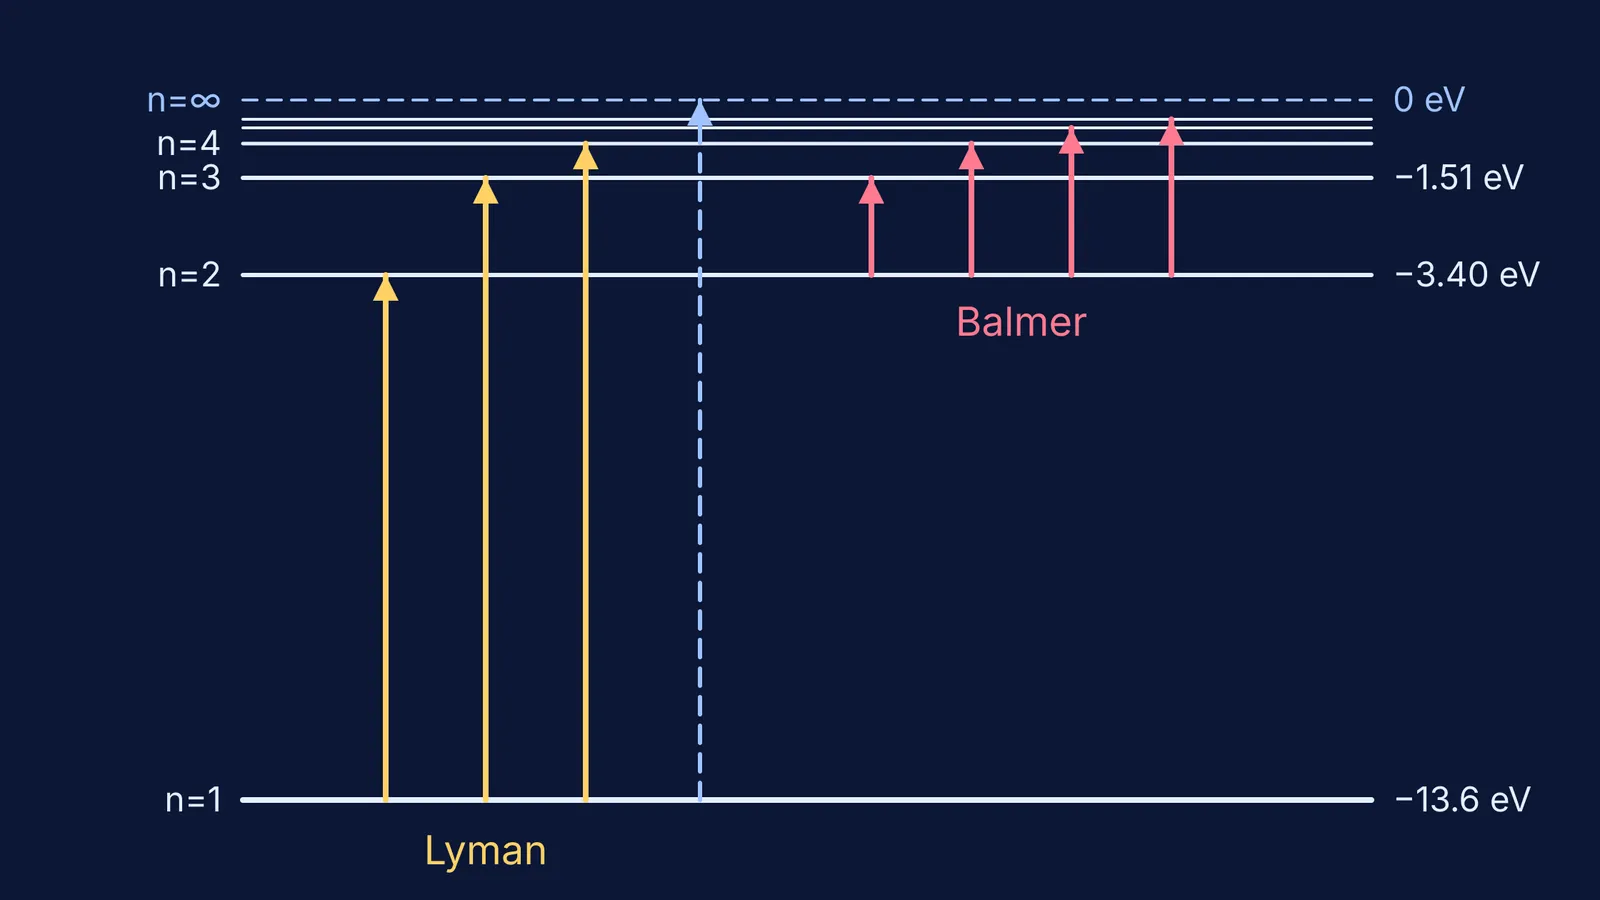
Bohr's model allows the electron's angular momentum only in whole-number steps of h/2π, so only certain orbits exist, each with a fixed energy. For hydrogen this works out to E = −13.6 eV / n², where n = 1, 2, 3 and so on. The 13.6 is hydrogen's ionisation energy, which NIST gives as 13.598433 eV (NIST Atomic Spectra Handbook). The minus sign means the electron is bound; at zero it is free.
These are the levels you will use:
n = 1: −13.6 eV (ground state)
n = 2: −3.40 eV
n = 3: −1.51 eV
n = 4: −0.85 eV
n = ∞: 0 eV (electron free)
The model works for hydrogen and one-electron ions such as He⁺, but not for atoms with more electrons. Our post on what Niels Bohr's atom model got right and what replaced it follows the story to quantum mechanics.
Which wavelengths does hydrogen absorb from the ground state?
Start with the atom in n = 1 and fire five photons, using the level energies above, based on NIST's hydrogen data. To convert between energy and wavelength, use λ (nm) ≈ 1240 / E (eV), explained in our guide to the 1240/λ photon energy shortcut.
10.2 eV: absorbed. That is the gap −3.40 − (−13.6), so the electron jumps from n = 1 to n = 2. Wavelength: 1240 / 10.2 ≈ 121.6 nm.
11.0 eV: passes through. The electron would land at −2.6 eV, where there is no level.
12.09 eV: absorbed, n = 1 to n = 3. Wavelength ≈ 102.6 nm.
12.75 eV: absorbed, n = 1 to n = 4. Wavelength ≈ 97.3 nm.
15.0 eV: ionised. 13.6 eV frees the electron and the other 1.4 eV becomes its kinetic energy. Any photon above 13.6 eV can do this, because a free electron can have any energy.
The arithmetic matches NIST's reference data, which lists the strongest ultraviolet hydrogen lines at 1215.67 Å, 1025.72 Å and 972.54 Å in vacuum, which are 121.6, 102.6 and 97.3 nm (NIST strong lines of hydrogen).
What are the Lyman and Balmer series?
A series is the family of lines sharing a lower level. The Rydberg formula gives each line: 1/λ = R (1/n₁² − 1/n₂²). The Rydberg constant is R = 10 973 731.568 157 m⁻¹ (NIST CODATA value). For hydrogen it is very slightly smaller, because the nucleus is not infinitely heavy.
Lyman series (n₁ = 1): every jump to or from the ground state. All are ultraviolet, bunching towards 1240 / 13.6 ≈ 91.2 nm, the ionisation edge.
Balmer series (n₁ = 2): jumps to or from n = 2. NIST lists their strongest components in air at 6562.85 Å, 4861.36 Å, 4340.46 Å and 4101.74 Å, which are red 656 nm, blue-green 486 nm, and violet 434 and 410 nm (NIST strong lines of hydrogen).
Cold hydrogen absorbs almost only Lyman lines, because nearly every atom sits in n = 1. To absorb Balmer light an atom must already be in n = 2, which happens in hot gas such as some stellar atmospheres. A glowing hydrogen tube shows the reverse: electrons falling back to n = 2 give out those visible colours.
How do you learn the hydrogen spectrum with a simulation?
Predict first, then test:
Write the five energy levels on paper.
Before firing, write three photon energies that will be absorbed and two that will pass through.
Fire each one and mark your predictions right or wrong.
Switch to wavelength and repeat, converting with 1240 / λ.
Put the electron in n = 2 and predict the first three Balmer lines.
The Fermi Simulation Lab has interactive simulations for ideas that are easier to see than to read, so you can test predictions like these yourself. If the minus signs or n = ∞ trip you up, the Fermi Concept Library has a lesson for each concept and shows where it fits in the map.
Once your predictions keep coming out right, try exam-style questions in our hydrogen spectrum problems on energy levels, series and wavelengths.


