

On this page
If you take a photo of a tricky physics graph and ask an AI tutor for help, the answer often sounds confident but gets the math completely wrong.
This happens because there is a gap between how well AI models reason about text and how well they "see" images. When you understand why AI misreads graphs, you can change how you ask the question. By adding a few lines of text describing what the graph shows, you can get the AI to explain the underlying physics correctly.
Why does AI struggle to read graphs?
Large Language Models (LLMs) are much better at physics theory than they are at visual tasks. A 2024 study in Physical Review Physics Education Research tested GPT-4V on the Test of Understanding Graphs in Kinematics (TUG-K). The researchers found that while the AI's textual reasoning was correct nearly 70% of the time, its visual interpretation of the graphs was error-free in only 30.9% of responses.
The AI often hallucinates features that are not there. It might assume a line starts at the origin (0, 0) when it actually starts higher up the y-axis. It struggles to read specific coordinates accurately, and it can confuse the height of a point on the graph with the slope of the line at that point.
Because the AI knows the rules of physics, the trick is to act as its eyes. Tell it what the axes are and what shape the line makes, and let the AI do the heavy lifting of explaining the concepts.
How do I explain a velocity-time graph to AI?
When you are looking at a velocity-time (v-t) graph, you are usually trying to find acceleration (from the slope) or displacement (from the area under the curve).
If you just upload an image of the graph and ask, "How do I solve this?", the AI might incorrectly identify a data point as being at 12 m/s instead of 10 m/s. That small visual error ruins the entire calculation, even if the formula the AI uses is right. Instead, give the AI a quick summary of the visual data.
You might write a prompt like this:
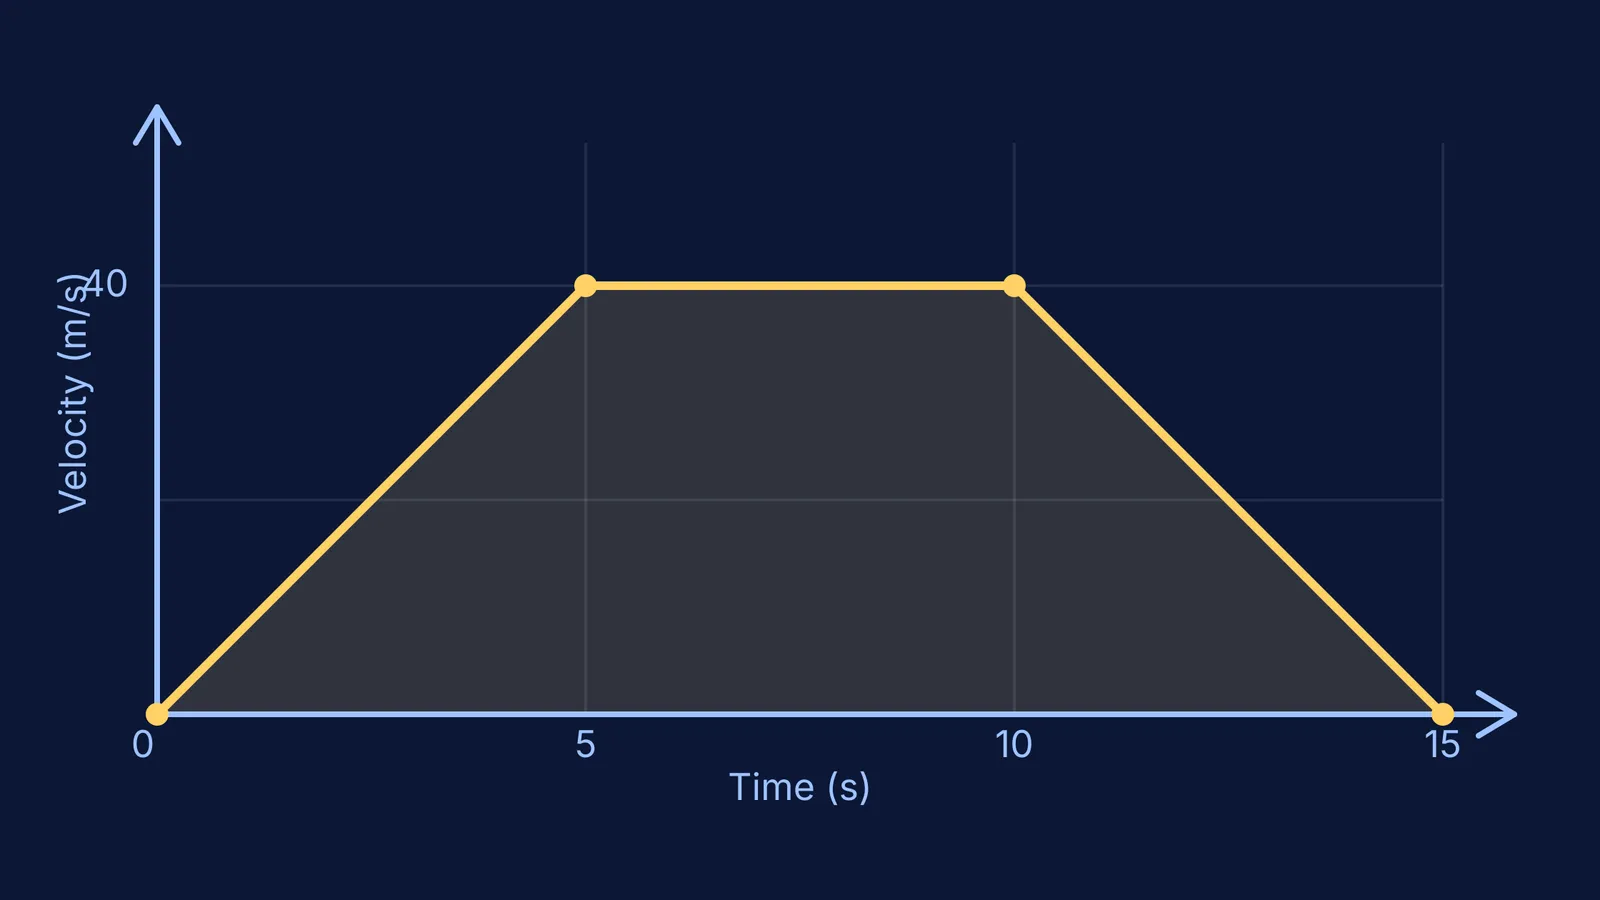
I am looking at a velocity-time graph. The x-axis is time t in seconds, and the y-axis is velocity v in m/s. The line starts at v = 0 when t = 0. It goes up in a straight line to v = 40 at t = 5, stays flat until t = 10, and then drops in a straight line back to v = 0 at t = 15. Can you explain how to find the total displacement?
By giving the AI the exact coordinates, it no longer has to guess where the lines intersect. It can rely on its strong textual reasoning to tell you that the area under a v-t graph represents displacement. It will then walk you through calculating the area of the first triangle (the acceleration phase), the rectangle in the middle (the constant velocity phase), and the final triangle (the deceleration phase), adding them up for the final answer.
How do I describe a P-V indicator diagram?
Thermodynamics problems often use Pressure-Volume (P-V) graphs, also known as indicator diagrams. These graphs are notorious for tripping up AI models because the direction of the process matters just as much as the shape of the curve. A clockwise loop means something entirely different from a counter-clockwise loop.
When you need help reading the loop on an indicator diagram, you must describe the arrows indicating the direction of the cycle, along with the shapes of the paths.
Try this approach:
This is a P-V graph for an ideal gas. The y-axis is pressure in atm, and the x-axis is volume in litres. The gas goes through a cyclic process A → B → C → A. A to B is a horizontal line to the right. B to C is a vertical line downwards. C to A is a curve curving upwards and to the left. Can you explain which steps involve work being done by the gas?
Once the AI has this text, it can correctly apply the rules of thermodynamics. It will explain that work is the area under the P-V curve, and that the horizontal expansion from A to B means work is done by the gas (positive work). It will also point out that the vertical line from B to C represents an isochoric process where the volume does not change, meaning zero work is done. It can also help you with Converting PV, PT and VT graphs of ideal gas processes once it clearly understands the mathematical relationships you have outlined.
How can an AI tutor help build intuition?
If you are stuck on a concept, a good AI tool should act as a guide, not an answer key. The goal of studying is not just to get the homework done, but to build a mental model of how the physics works.
Fermi's AI tutor can work out what you already know and build a plan for the session. Rather than just giving you the final number for an area calculation, the tutor teaches through the problem—writing on a board, drawing the figure, and checking your understanding as it goes.
When you sit down with a difficult graph, describe the visual elements clearly in text. The AI will then take over to hold the line of reasoning, helping you connect the shape of the line to the physical reality it represents.


