

On this page
Biology students spend a lot of time memorising facts for NEET, but when it comes to reading graphs, many hit a wall. Whether it is an enzyme activity curve in biomolecules or a logistic growth model in ecology, experimental graphs ask students to do more than just read numbers. They have to connect a visual trend to a biological process.
Research published in Advances in Physiology Education shows that student difficulties with graph choice, axis scaling, and variable placement are well documented. More importantly, instructional materials often fail to teach the complex reasoning behind these graphs. This leaves students to guess why a curve takes a certain shape. In high-stakes exams, interpreting data under pressure becomes a major hurdle when foundational concepts are weak.
This is where an interactive approach helps. Rather than just staring at an NCERT figure and trying to memorise its shape, students can use an AI tutor to break down what every part of the graph means and how it was constructed from raw biological data.
Can AI explain biology graphs for NEET?
Yes. When you scan an assignment or a difficult graph from your textbook, Fermi works out what you already know, builds a plan for the session, and teaches through it. It holds a line of reasoning, explaining why an enzyme activity graph is a bell curve for temperature but a rectangular hyperbola for substrate concentration.
If you are stuck on why an oxygen dissociation curve shifts to the right under high carbon dioxide levels, the tutor does not just hand you the Bohr effect definition. Instead, it walks you through how hemoglobin's affinity for oxygen changes, ensuring you understand the mechanism rather than just memorising the shift.
How to read enzyme activity and population curves?
NCERT biology relies on several classic graphs. Understanding them requires a reliable framework for approaching any experimental curve, rather than treating each graph as a separate memory task.
Check the axes first: Always identify the independent variable on the x-axis. Is it temperature, pH, or time? Next, find the dependent response on the y-axis, such as reaction velocity or population size.
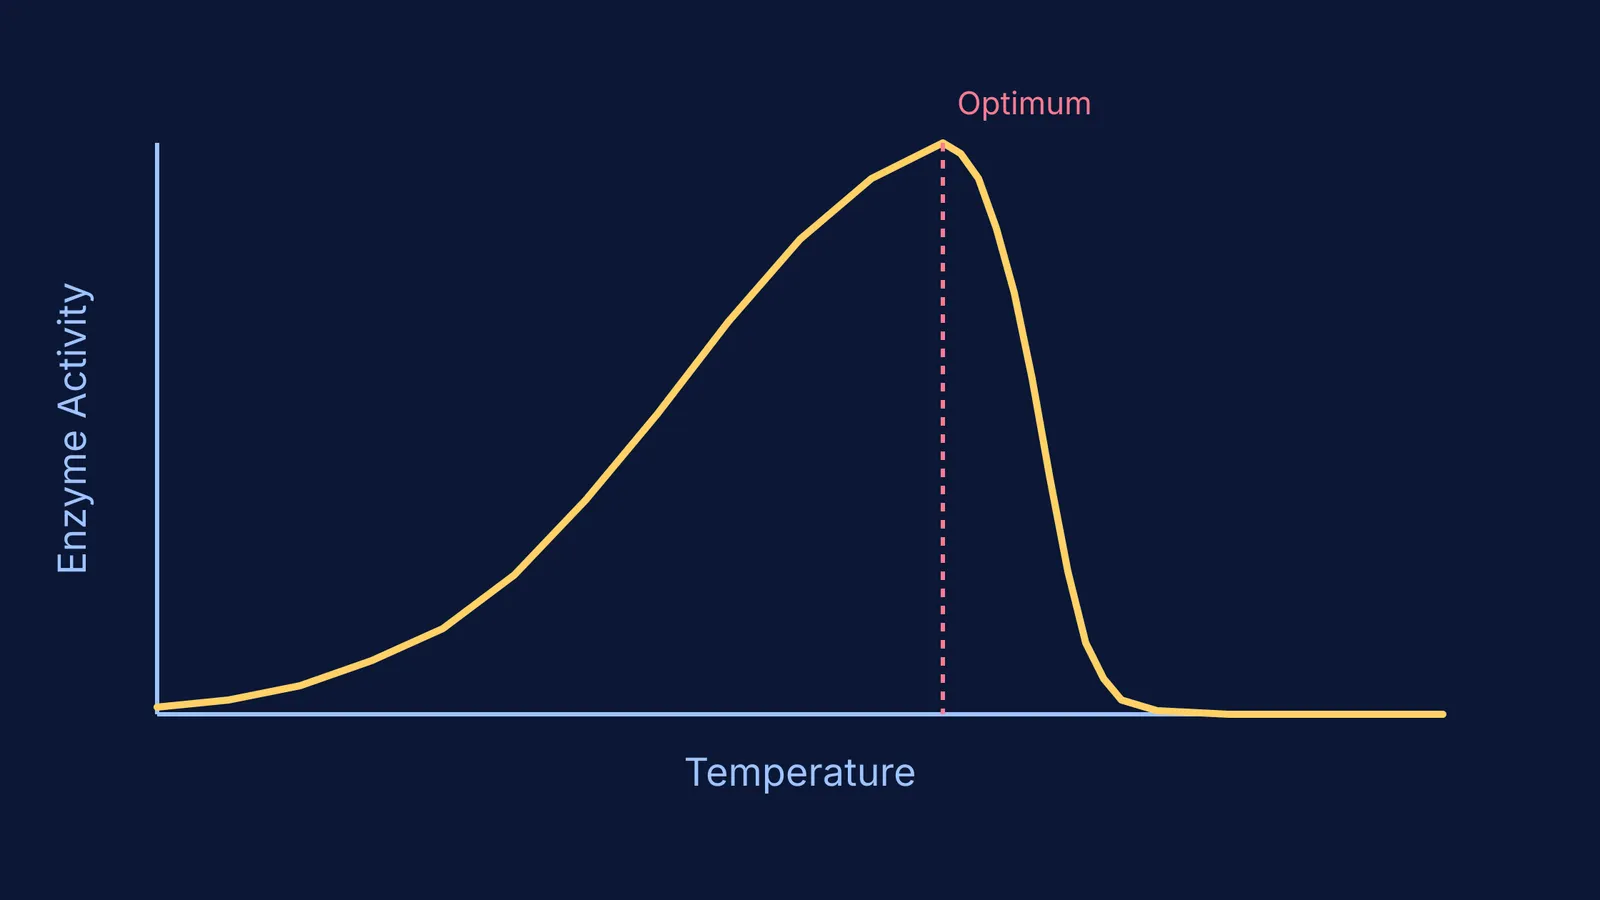
Look for the peak (or plateau): In an enzyme temperature graph, the peak represents the optimum temperature where kinetic energy is high but the enzyme remains stable. Past this point, the curve drops sharply as the enzyme denatures. In population curves, a plateau indicates the carrying capacity of the environment, where births and deaths reach equilibrium.
Connect the shape to the biology: A straight line means a constant rate. An exponential curve (like a J-shape) shows unchecked growth, often seen when a species colonises a new, resource-rich habitat. A logistic curve (S-shape) shows growth slowing down as resources run out and competition increases. For a deeper look at reaction rates, you might explore the Michaelis-Menten equation for enzyme speed.
For ideas that are harder to picture from a static NCERT figure, the Fermi Simulation Lab provides interactive simulations for the ideas that are easier to see than to read. You can change the variables—like adding a competitive inhibitor—and watch how the graph updates in real time.
What is a checklist for practicing with experimental graphs?
When practicing past questions that feature graphs, use this routine to ensure you are interpreting the data correctly and building strong reasoning skills:
Identify the variables on the x-axis and y-axis before looking at the multiple-choice options.
Notice where the curve starts, where it peaks, and where it flattens.
Ask yourself: "What biological factor is causing this shape?" (e.g., enzyme saturation, limited resources, or natural selection pressures).
Look out for asymptotes. For example, why does the curve for substrate concentration flatten out instead of dropping? (Because all active sites are occupied).
Compare similar graphs. For instance, how does a directional selection curve differ from a disruptive one? (See Stabilising, directional and disruptive selection: reading curves for a comparison).
By moving away from rote memorisation and focusing on the reasoning behind the data, students can turn confusing graphs into a reliable source of clarity. Learning to extract the biological story from a curve will help you long after the exam is over.


