

On this page
A titration curve is a graph of a solution's pH as titrant is added, as the LibreTexts titration curves chapter defines it. It teaches more if you predict its shape first. Here is a run for any titration simulator, or a calculator and graph paper: 25.00 mL of 0.100 M acid against 0.100 M NaOH, the setup in OpenStax Chemistry 2e, once with hydrochloric acid and once with acetic acid.
Where does the equivalence point fall in a titration?
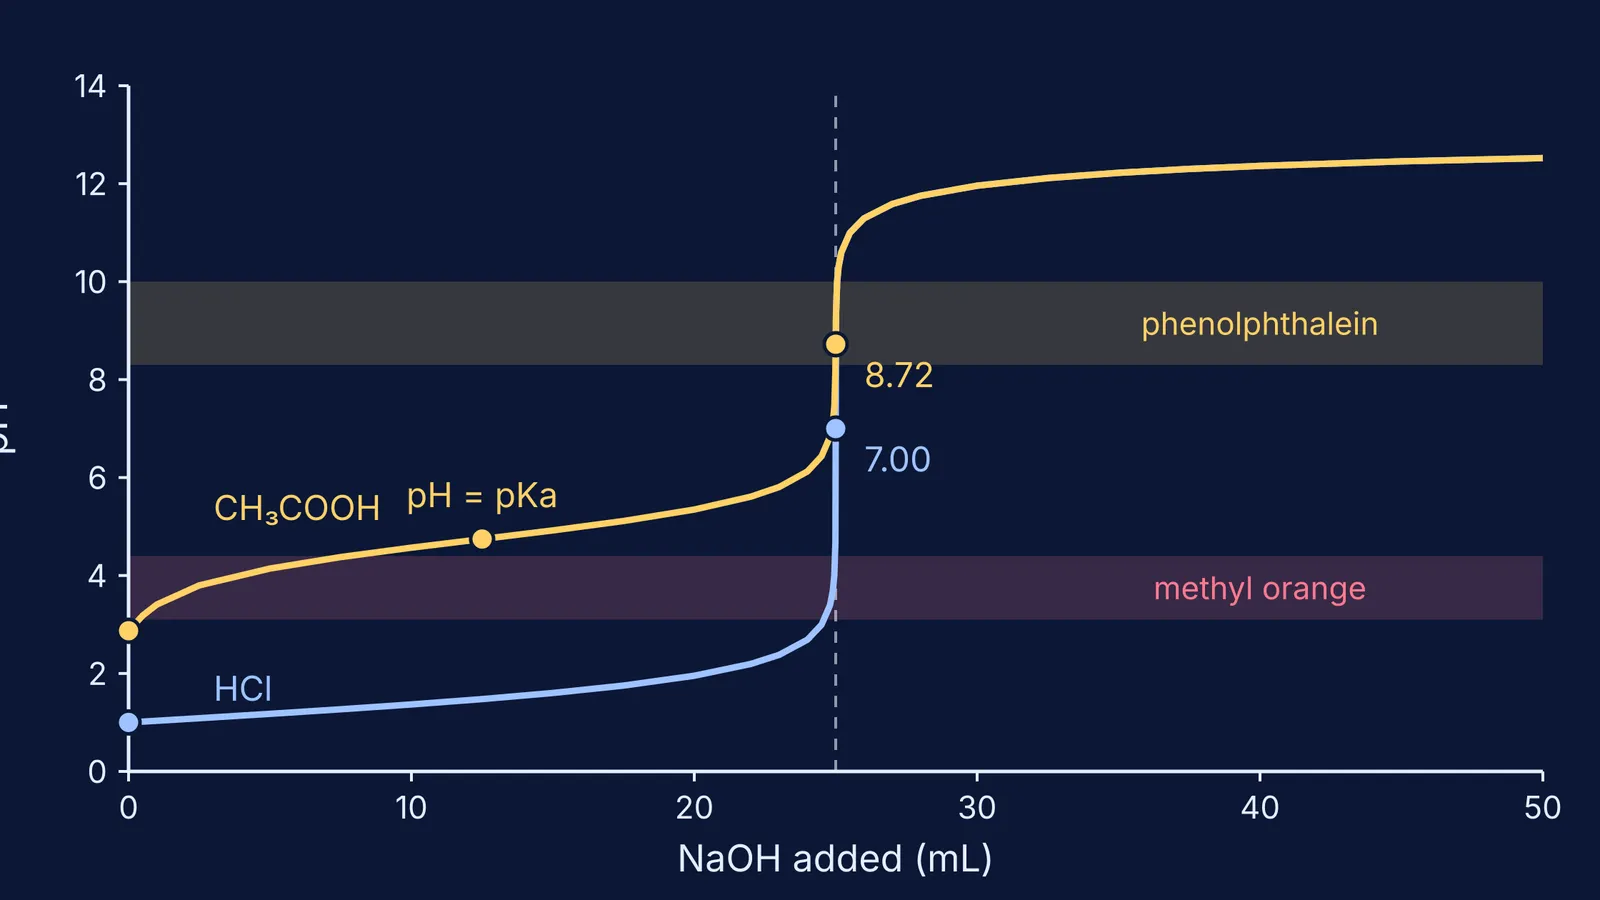
The equivalence point is where the moles of base added equal the moles of acid you started with, whatever the acid's strength. Here 25.00 mL × 0.100 M is 2.50 mmol of acid, so both curves reach equivalence at 25.00 mL of NaOH.
What changes is the pH at that volume. OpenStax gives pH 7.00 at the equivalence point for HCl and pH 8.72 for acetic acid (OpenStax Chemistry 2e). At the HCl equivalence point the flask holds only sodium chloride and water. At the acetic acid equivalence point it holds sodium acetate, and acetate is slightly basic, so the solution ends up slightly alkaline (LibreTexts pH titration curves/Equilibria/Acid-Base_Equilibria/pH_Titration_Curves)).
The general rule: strong acid with strong base gives pH 7 at equivalence, weak acid with strong base gives above 7, and strong acid with weak base gives below 7 (LibreTexts).
Why does the weak acid curve start at a higher pH?
Both flasks hold acid at the same concentration, but HCl ionises completely and acetic acid does not. Using Ka = 1.8 × 10⁻⁵, OpenStax works out [H₃O⁺] = 1.3 × 10⁻³ M for 0.100 M acetic acid, a starting pH of 2.87 against 1.00 for HCl (OpenStax Chemistry 2e). So only about 1.3% of the acetic acid molecules have given up a proton.
Add a little NaOH and the acetic acid curve rises quickly, then flattens, because acetic acid plus acetate is a buffer. Halfway to equivalence, at 12.50 mL, half the acid has become acetate and pH = pKa = 4.74 (OpenStax). That reading lets you measure Ka straight off the graph. Our guide to Henderson-Hasselbalch buffer problems covers why that region resists change.
Predict, then run: six checkpoints
Cover the answers, predict both pH values at each volume, then check. All values are from the OpenStax table and worked example (OpenStax) except the HCl value at 12.50 mL, which we calculated from the moles of acid left over.
0 mL: HCl 1.00, acetic acid 2.87.
12.50 mL: HCl 1.48, acetic acid 4.74. HCl has no buffer region, so it barely moves.
24.90 mL: HCl 3.70, acetic acid 7.14. The weak acid is already near neutral before equivalence.
25.00 mL: HCl 7.00, acetic acid 8.72.
25.10 mL: both 10.30. Once NaOH is in excess, it controls the pH and the two curves merge.
50.00 mL: both 12.52.
Compare checkpoints 3 and 5. Across those 0.20 mL, HCl jumps about 6.6 pH units and acetic acid only about 3.2, higher up the scale. That decides the indicator.
Harder prediction: dilute everything ten times. The equivalence volume stays at 25.00 mL, the jump shrinks, and by our calculation the acetic acid equivalence pH falls to about 8.22. The method is in our guide to the pH after mixing acids and bases.
Which indicator suits each titration?
An indicator works if its colour change happens on the steep part of the curve. LibreTexts gives methyl orange a range of pH 3.1 to 4.4 and phenolphthalein a range of pH 8.3 to 10.0 (LibreTexts acid-base indicators/Equilibria/Acid-Base_Equilibria/6._Acid-Base_Indicators)).
Strong acid with strong base: either works, because the HCl jump runs from about pH 3.7 to 10.3 within 0.2 mL and covers both ranges.
Weak acid with strong base: phenolphthalein. In our calculation acetic acid passes pH 4.4 at about 7.8 mL, so methyl orange would finish changing long before equivalence. OpenStax also concludes that only phenolphthalein is suitable for the weak acid titration (OpenStax).
Strong acid with weak base: methyl orange, which changes colour on the steep part of that curve.
Weak acid with weak base: neither; LibreTexts advises against titrating this pair with an indicator at all (LibreTexts/Equilibria/Acid-Base_Equilibria/6._Acid-Base_Indicators)).
How do you get the most out of a titration simulation?
Predict before you click, and write the guess down.
Change one thing at a time (Ka, concentration or acid) and say what moved.
Read off the half-equivalence pH and turn it back into Ka.
Sketch the curve from memory afterwards.
For stage-by-stage calculations, see our guide to acid-base titration curves and choosing indicators. If a curve still won't make sense, Fermi's AI tutor can work through it with you, drawing the figure and checking your understanding as it goes. For other ideas easier to see than to read, try the Fermi Simulation Lab.


