

On this page
If we want to know what the weather was like 50,000 years ago, we cannot look at a thermometer. For a long time, paleoclimatology relied on describing rocks and fossils to guess at ancient environments. Willi Dansgaard changed this by turning the ice sheets into a precise timeline of Earth's temperature.
How do oxygen isotopes record past climate?
In 1954, Dansgaard discovered that the isotopic composition of rainwater90003-4) was directly linked to the temperature at which the rain formed. Oxygen has two main stable isotopes: the lighter oxygen-16 and the heavier oxygen-18. When water evaporates from the ocean, the lighter oxygen-16 turns into vapour more easily. When the vapour condenses into rain or snow, the heavier oxygen-18 falls out more quickly. (Read more about Frederick Soddy and the discovery of isotopes.)
As a weather system moves from the warm equator towards the cold poles, it loses water. Because oxygen-18 is heavier, it rains out first. The colder the air gets, the more oxygen-18 it loses before the snow reaches Greenland or Antarctica. Dansgaard realised that by measuring the ratio of oxygen-18 to oxygen-16 in a sample of snow, he could calculate the temperature of the air when that snow formed.
Understanding this kind of isotope fractionation requires a solid grasp of how mass affects phase changes in physical chemistry. If you find it hard to picture why heavy molecules behave differently, the Fermi Concept Library breaks down the kinetic theory of gases step by step. When the textbook explanation leaves you stuck, Fermi's AI tutor can run a session that builds on what you already know, helping you reason through the physics of evaporation and condensation yourself.
What do ice cores tell us about climate change?
Because the polar ice sheets are built from year after year of snowfall, drilling into the ice is like drilling into time. In 1969, Dansgaard and his colleagues published their analysis of the Camp Century ice core, which was 1,390 metres deep from Northwest Greenland. By measuring the oxygen isotopes layer by layer, his team produced a continuous record of Earth's climate stretching back over 100,000 years.
Before this work, geologists thought the climate only shifted slowly, over tens of thousands of years. But the ice cores showed sudden, violent temperature jumps. Dansgaard and his colleagues found that during the last glacial period, the climate sometimes warmed abruptly in just a few decades. These rapid shifts, now called Dansgaard-Oeschger events, proved that the Earth's climate system has tipping points. Today, these ancient records are vital for testing the first computer climate models and understanding the orbital cycles behind ice ages.
How do you read the ice core thermometer?
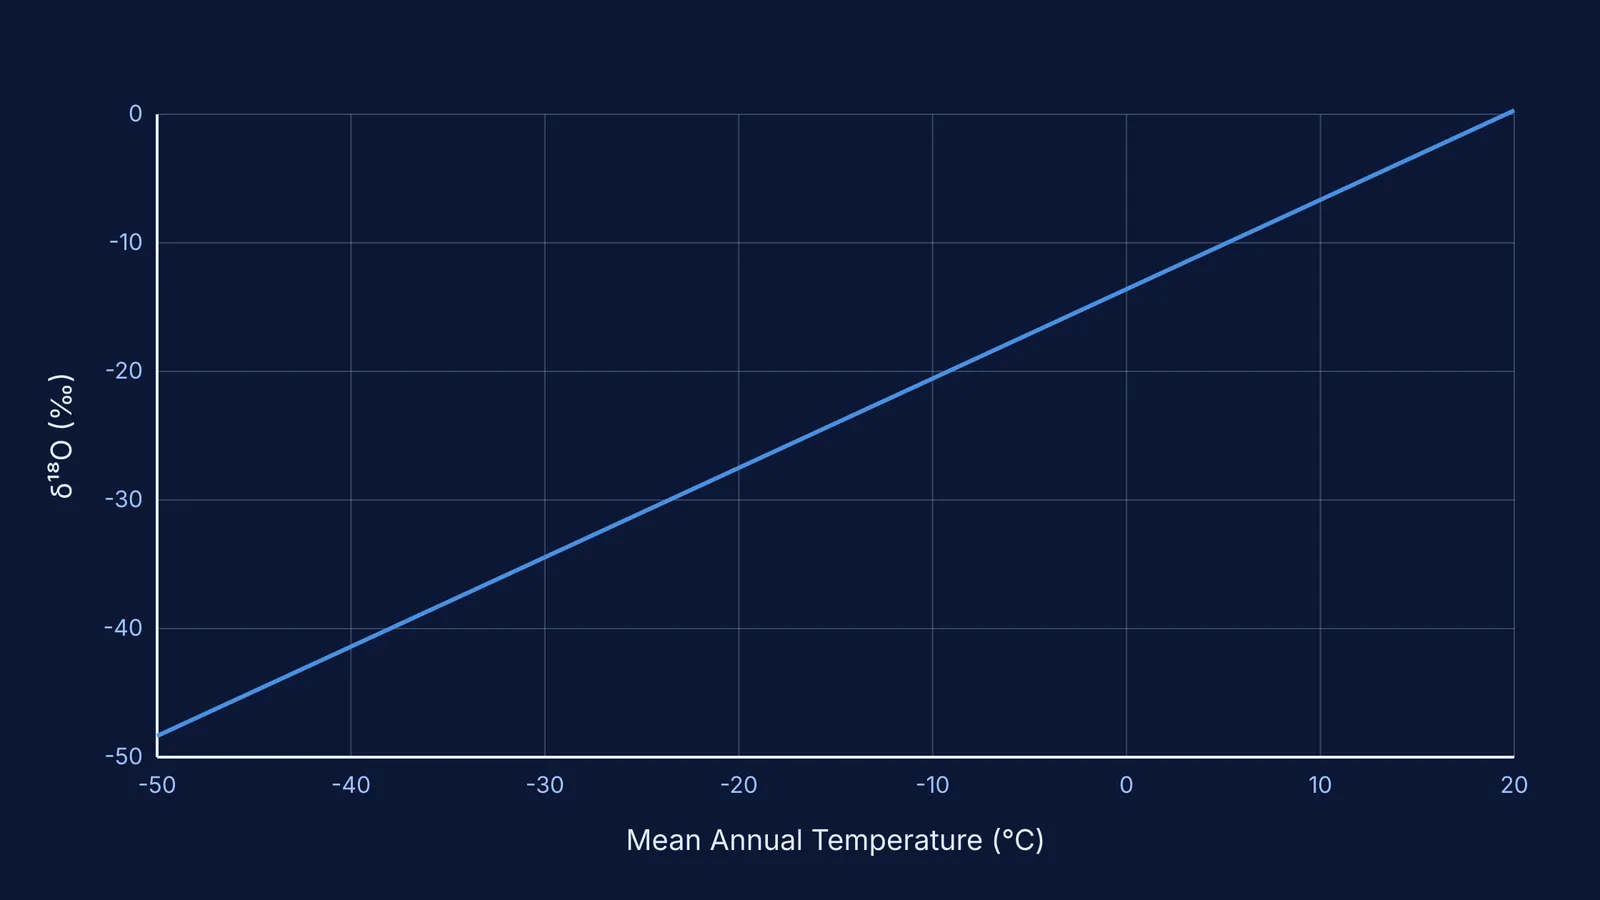
In a 1964 paper, Dansgaard established the empirical relationship for Greenland between the mean annual temperature (T, in °C) and the oxygen isotope ratio (δ¹⁸O, in parts per thousand, ‰). The formula is:
δ¹⁸O = 0.695 × T − 13.6
Suppose a layer of ice deep in a core has a measured δ¹⁸O value of −40 ‰. What was the mean temperature when that snow fell?
Write the equation: −40 = 0.695 × T − 13.6
Add 13.6 to both sides: −26.4 = 0.695 × T
Divide by 0.695 to find T: T = −26.4 / 0.695
The result is roughly −38.0 °C.
If a shallower, more recent layer has a δ¹⁸O of −35 ‰, the temperature was (−35 + 13.6) / 0.695 = −30.8 °C. The more negative the isotope ratio, the colder the climate was when the ice formed.


