

On this page
Why did Walter Shewhart invent the control chart in 1924?
In the 1920s, telephone networks were expanding across North America. Western Electric, the manufacturing branch of the Bell Telephone System, produced the hardware that kept this infrastructure running—carbon microphones, switchboard relays, and vacuum tube repeaters installed in underground conduits. If a component failed in a buried line, replacing it required excavating conduits at substantial expense, far exceeding the cost of making the original part (Quality and Safety in Health Care).
Physicist Walter Andrew Shewhart joined Western Electric's Inspection Engineering Department in 1918 after earning his doctorate at the University of California, Berkeley. At the Hawthorne Works in Cicero, Illinois, Shewhart noticed a baffling pattern. When an inspector measured a part slightly below target, engineers immediately tightened a bolt or altered machine settings. When the next part measured slightly high, they adjusted the machine in the opposite direction.
Instead of reducing errors, this constant tinkering made dimensions more irregular. Shewhart recognized that engineers were committing what is now called over-adjustment or tampering. By reacting to every minor fluctuation as an active defect, they injected manual variance into an otherwise stable process.
How does a Shewhart control chart separate noise from real faults?
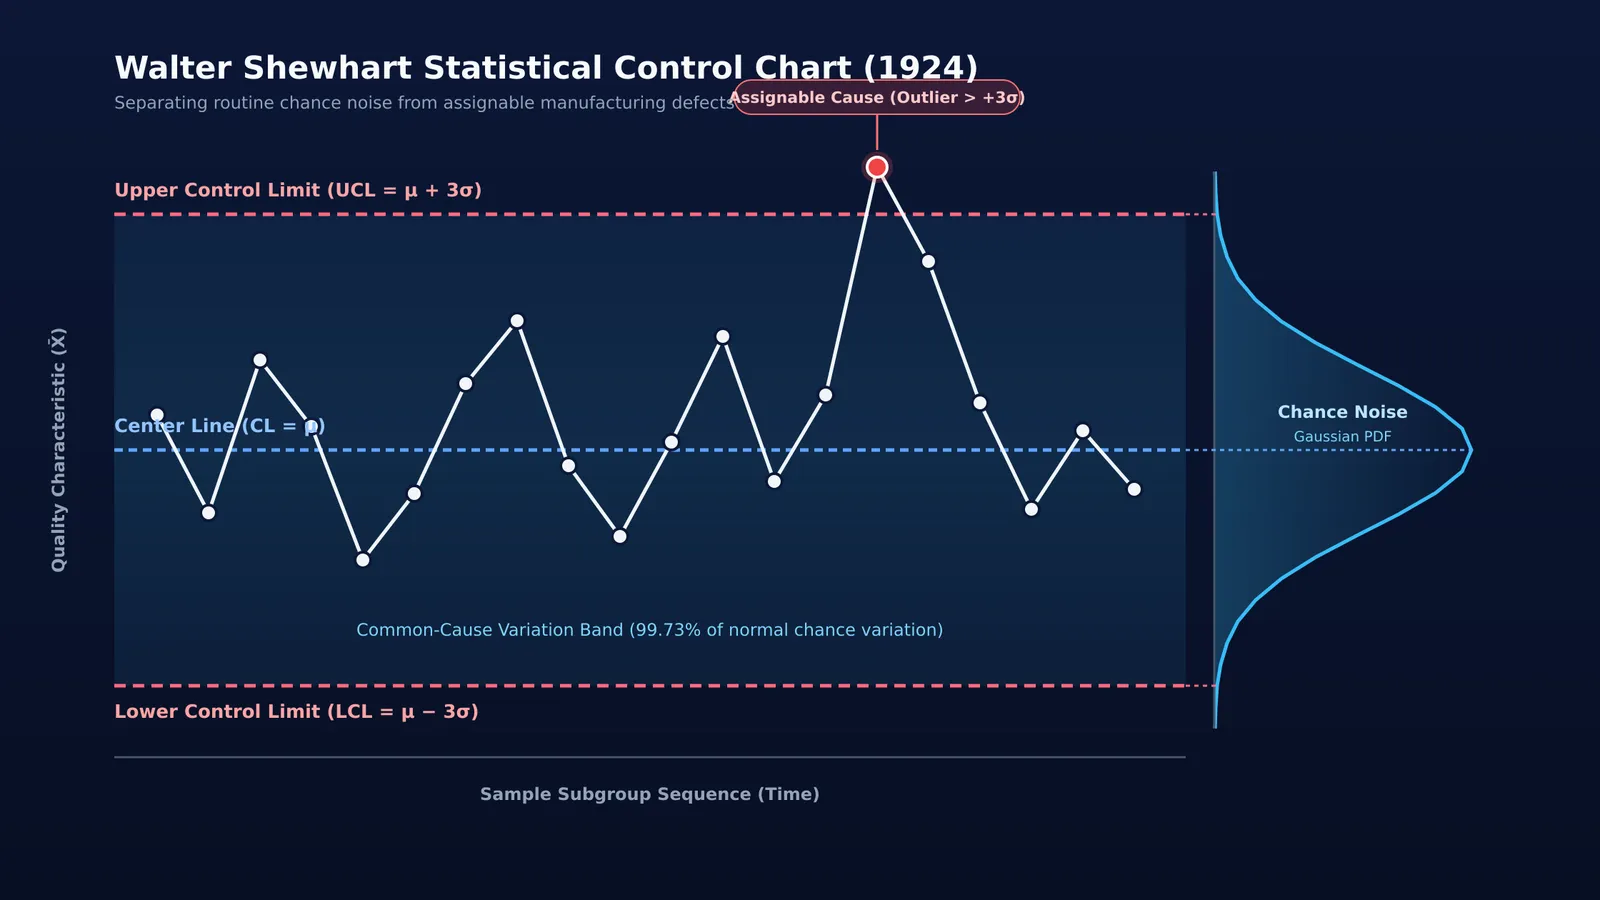
On May 16, 1924, Shewhart submitted a one-page memorandum to his supervisor at Western Electric sketched with the world's first statistical control chart: a central target line flanked by upper and lower boundary lines (Quality and Safety in Health Care). In 1926, he published the complete framework in the Bell System Technical Journal.
Shewhart demonstrated that process variability stems from two distinct causes:
Chance causes (common cause variation): the natural background noise of a stable system, caused by dozens of minor environmental and mechanical factors acting together, such as ambient temperature shifts and tool vibration. Adjusting a machine after a routine chance fluctuation widens total variance.
Assignable causes (special cause variation): specific disturbances originating outside normal operations, such as a damaged cutting tool, impure raw materials, or an operator slip. These demand immediate investigation and correction.
As the National Institute of Standards and Technology notes, a process is in statistical control when its points fluctuate randomly between its limits without predictable patterns (NIST Engineering Statistics Handbook). The chart tells engineers when to fix an assignable fault and when to leave a stable system alone.
Why did Shewhart choose three-sigma limits?
Rather than using an arbitrary threshold, Shewhart placed the Upper Control Limit (UCL) and Lower Control Limit (LCL) at three standard deviations (±3σ) from the process mean in his 1926 paper (Bell System Technical Journal).
Shewhart designed this boundary around economic trade-offs. Quality control must balance two competing costs: false alarms (searching for non-existent problems and tampering with stable machines) versus missed signals (failing to catch a genuine defect).
Setting limits at ±3σ balances these costs. For a normal distribution, 99.73% of data falls inside ±3σ, meaning false alarms occur only 0.27% of the time, or roughly 1 in 370 samples under chance alone (NIST Engineering Statistics Handbook). Moreover, under Chebyshev's inequality, for any distribution with finite variance, at most 1/9 (about 11.1%) can fall outside three standard deviations, and the Camp-Meidell inequality tightens this ceiling to under 5% for unimodal distributions (Quality and Safety in Health Care). Points falling outside ±3σ are therefore statistically rare under chance alone.
Shewhart's methods quickly gained global prominence. In his later career, he served as a consultant for the United Nations and advised the government of India on introducing statistical quality control across manufacturing (Quality and Safety in Health Care).
How can students apply Shewhart's quality control to exam prep?
Students preparing for competitive examinations like JEE Main or CBSE boards frequently fall into the over-adjustment trap. When scores dip on a single practice test due to ordinary paper-to-paper variation, students often panic, overhaul their revision schedules, and discard routines that were working. As quality improvement researchers emphasize, tampering with a stable process in response to routine noise degrades performance rather than improving it (Quality and Safety in Health Care).
You can apply Shewhart's framework to test preparation:
Establish a baseline: Track your scores across multiple practice sets to understand your personal average and typical variation.
Respect routine variation: Moderate fluctuations reflect varying paper difficulty and normal fatigue. Do not alter your foundation over common-cause noise.
Act on assignable causes: If a score plunges unusually far below your baseline, or your error log reveals a recurring cluster of mistakes on one topic, investigate the root cause—such as a specific concept gap or pacing issue.
Adopt a systematic review habit by learning how to analyse a mock test and using your mock test data to separate random calculation slips from recurring conceptual gaps. When an assignable fault points to a concept weakness, the Fermi Concept Library offers dedicated lessons across physics, chemistry, biology, mathematics, and computing to help you rebuild the theory. To practice solving problems methodically, the Fermi Problem Library provides worked problems with a step-by-step solver that explains the reasoning rather than printing an answer. If an unusually tough test shakes your momentum, knowing how to bounce back after a bad test ensures you respond with data instead of frustration.


