On this page
Two questions sit behind every monsoon forecast. Where does all that water come from, and how can you watch it over an ocean where nobody lives? P. R. Pisharoty worked on both. He studied the moisture budget of the Arabian Sea, and he co-authored the study that first made India aware of remote sensing. This post covers what the record shows about him, a worked example on how sensors spot healthy plants from above, and what students can learn from his career.
Who was P. R. Pisharoty?
The Indian Institute of Tropical Meteorology (IITM) page on its former directors says he was born on 10 February 1909 in Kollengode, Kerala. He took a master's degree in physics from Madras University and a PhD from the University of California in 1954. An obituary in the Journal of the Geological Society of India gives his full name, Pisharoth Raman Pisharoty, and his life dates, 1909 to 2002.
He began as a physicist. One of his early papers, in the Proceedings of the Indian Academy of Sciences in 1941, was on X-ray reflections in diamond, written with R. V. Subrahmanian. By the 1950s he was publishing on the atmosphere, for example a 1957 paper on unstable ridges and the creation of kinetic energy in the atmosphere.
What did he build at IITM Pune?
The IITM history page explains that the Institute of Tropical Meteorology was founded on 17 November 1962 in Pune as a unit of the India Meteorological Department, after the World Meteorological Organization recommended research institutes in tropical countries. It became the autonomous Indian Institute of Tropical Meteorology in 1971.
Pisharoty was its founding director, from 1962 to 1967. The IITM page adds that he served on the WMO's Scientific Advisory Board from 1963 to 1968 and later chaired it, was vice-president of the International Association of Meteorology and Atmospheric Sciences, sat on the organising committee of the Global Atmospheric Research Programme from 1969 to 1977, and received the Padma Shri.
Where does the monsoon's moisture come from?
The summer monsoon carries enormous amounts of water vapour onto the west coast. A review of Indian monsoon research by D. R. Sikka in Mausam (2005) summarises Pisharoty's 1965 work on this question. By examining the moisture budget, he showed that evaporation over the Arabian Sea contributes substantially to the moisture flux crossing India's west coast. Later studies, Sikka notes, emphasised that much of the moisture is also carried across the equator by the cross-equatorial winds.
Sikka's review also cites Pisharoty and G. C. Asnani's 1957 study of where heavy rain falls around a monsoon depression.
How did remote sensing begin in India?
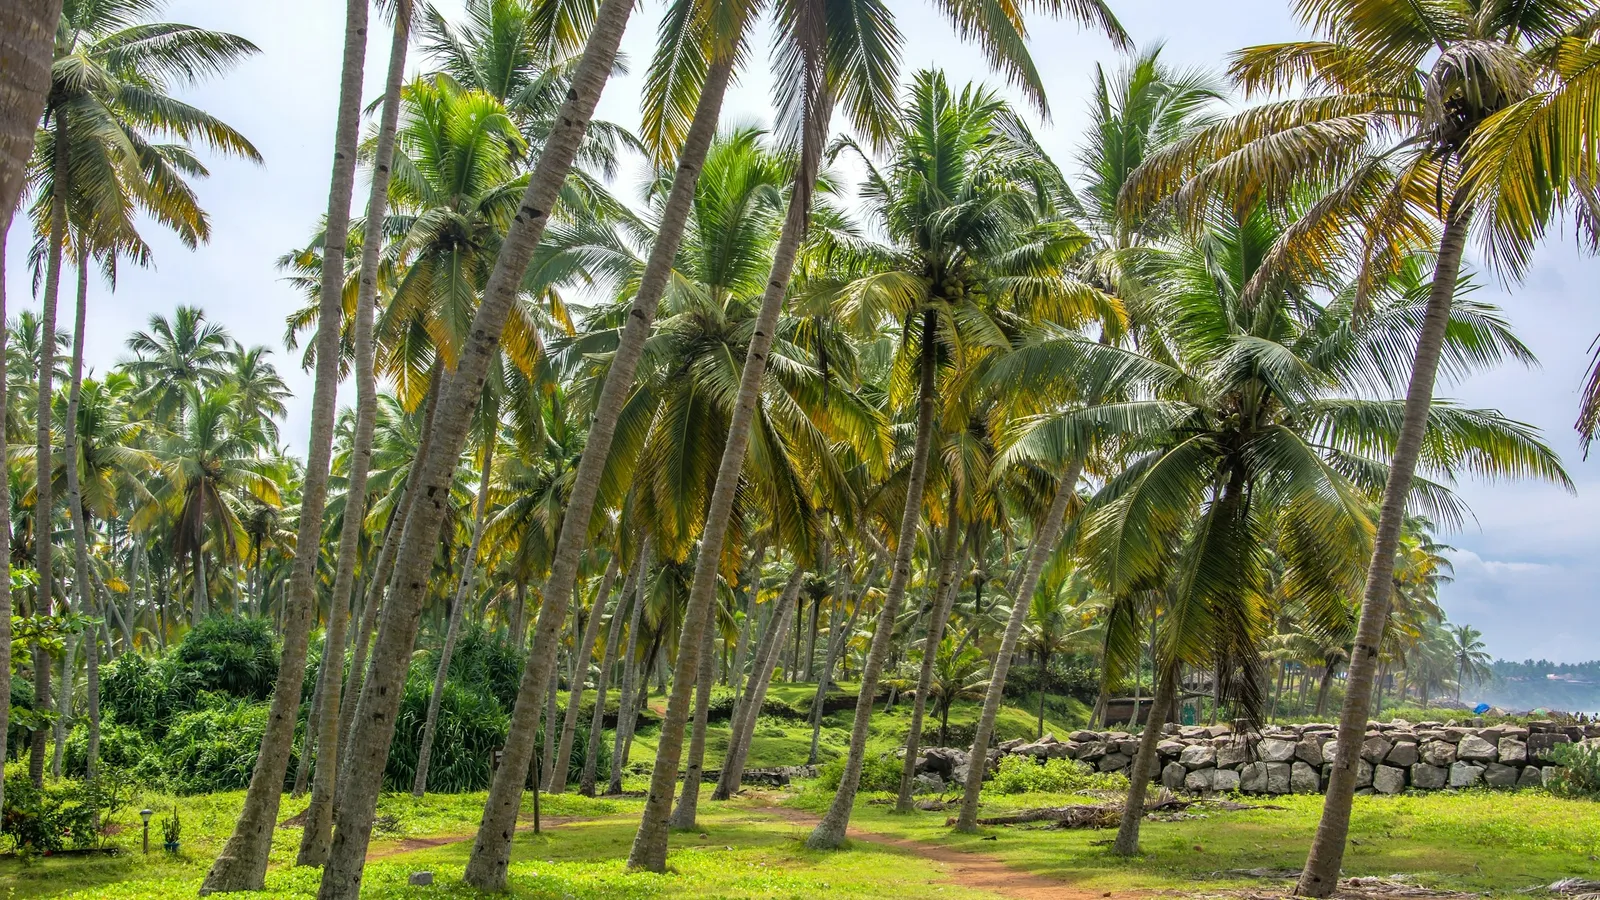
A history of geo-informatics in India by Gupta, Karnatak and Raju (2016) states that initial awareness of remote sensing in the country came from the first successful mission on coconut wilt (root) disease using remote sensing techniques, with Soviet aircraft and US equipment. The reference it gives is a 1971 paper, Remote sensing for coconut wilt, by C. Dakshinamurti, B. Krishnamurthy, A. S. Summanwar, P. Shanta and P. R. Pisharoty, presented at an international remote sensing symposium in Michigan.
That is the verified part of the story: Pisharoty co-authored the study credited with first raising awareness of remote sensing in India. India's own Earth observation satellites came later. ISRO's page on Bhaskara-II, launched in 1981, describes a camera with a visible band (0.54 to 0.66 micrometres) and a near-infrared band (0.75 to 0.85 micrometres) for hydrology, forestry and geology.
Worked example: spotting stressed plants from above
NASA's Earth Observatory explains that chlorophyll strongly absorbs visible light from 0.4 to 0.7 micrometres, while leaf cell structure strongly reflects near-infrared from 0.7 to 1.1 micrometres. The most common index built on this is the Normalized Difference Vegetation Index:
NDVI = (NIR - Red) / (NIR + Red)
where NIR and Red are the fractions of near-infrared and red light reflected. The numbers below are sample values for a classroom example, not data from the coconut wilt survey.
Healthy palm: NIR = 0.50, Red = 0.08. NDVI = 0.42 / 0.58 ≈ 0.72.
Stressed palm: NIR = 0.30, Red = 0.12. NDVI = 0.18 / 0.42 ≈ 0.43.
Bare sand: NIR = 0.25, Red = 0.20. NDVI = 0.05 / 0.45 ≈ 0.11.
NASA's page gives the scale: about 0.1 and below for rock, sand or snow, and 0.6 to 0.8 for dense forest. So the healthy palm reads like dense vegetation, and the stressed one is clearly lower.
Common mistakes: putting the bands the wrong way round (which flips the sign), or adding instead of subtracting in the numerator. A quick check is that NDVI must lie between -1 and +1.
What can a student take from how Pisharoty worked?
Follow the question across fields. He moved from X-ray physics to weather and then to a crop survey from the air.
Count the budget. Asking where every bit of moisture comes from, and where it goes, is the same habit as balancing energy in a physics problem.
Build places for others. Founding IITM gave Indian monsoon science a permanent home.
Reflection and absorption of light are easier to grasp when you can change the numbers and watch what happens. The Fermi Simulation Lab has interactive simulations for ideas that are easier to see than read. For another Indian scientist who moved from light to the atmosphere, read about K. R. Ramanathan.
Next step: work out the NDVI for a leaf with NIR = 0.45 and Red = 0.15, then decide whether it looks healthy.