

On this page
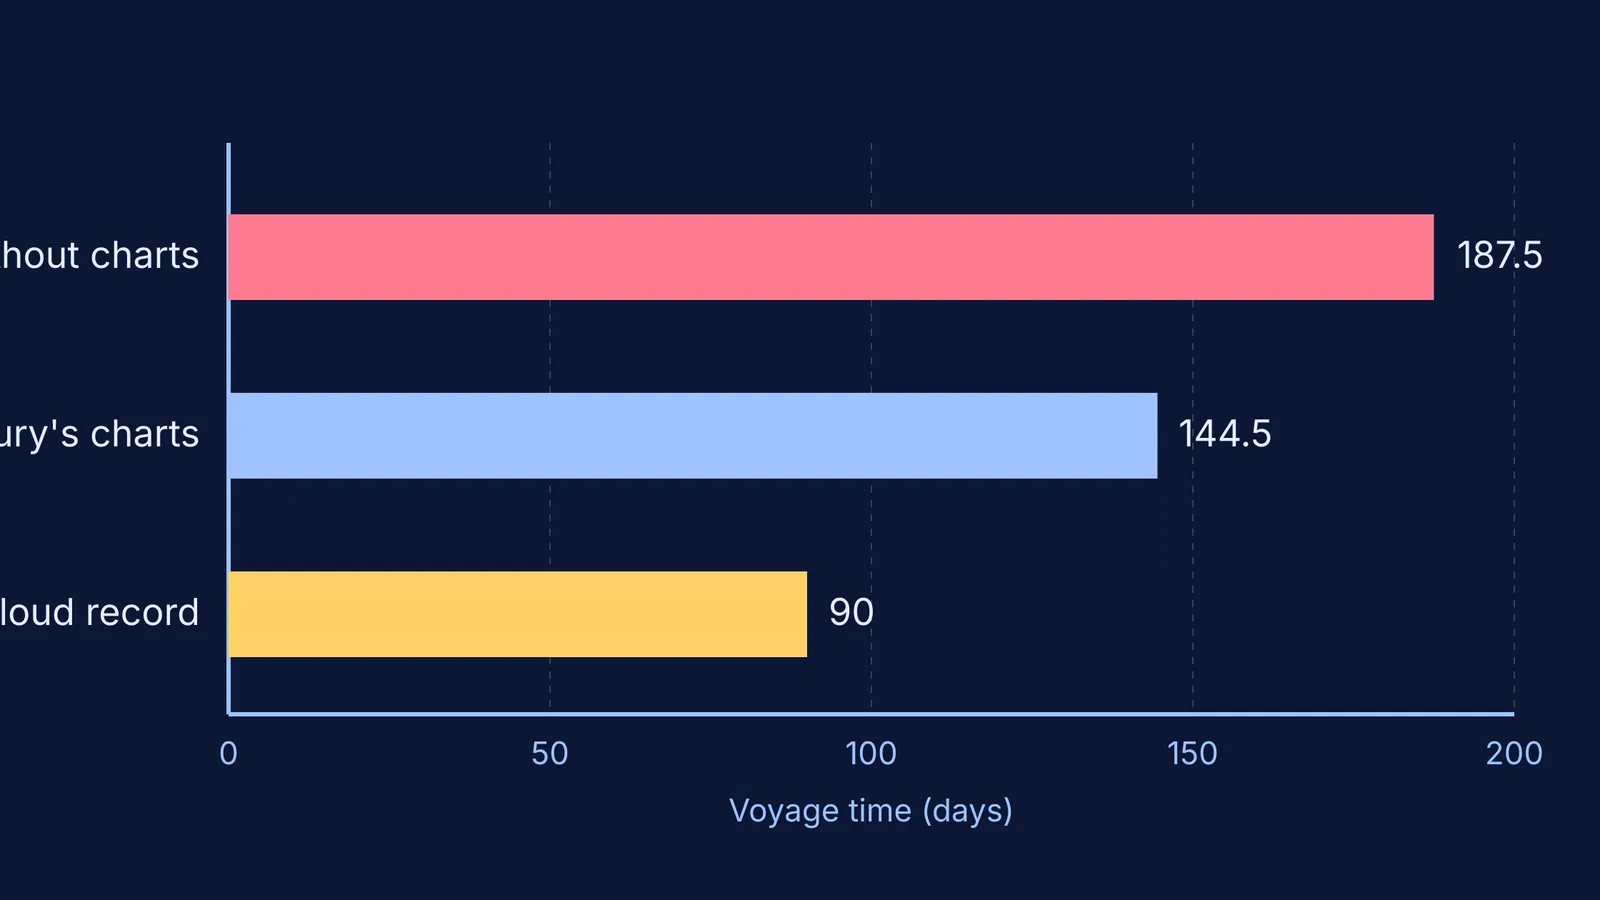
In the mid-19th century, a voyage from New York to San Francisco meant a perilous, 15,000-mile journey around Cape Horn that took an average of 187.5 days. Matthew Fontaine Maury, an American naval officer, changed this by treating the ocean not as an unpredictable mystery, but as a system with discoverable patterns.
How did an injury create the Pathfinder of the Seas?
Matthew Fontaine Maury began his career at sea, traveling the world as a young midshipman on voyages that sparked his obsession with the ocean. However, in 1839, a stagecoach accident left him with a permanently disabled right leg. Deemed unfit for active sea duty, he faced a bleak future. In 1842, he was appointed Superintendent of the Depot of Charts and Instruments, which later became the U.S. Naval Observatory.
This desk job could have been the end of his maritime influence, but it became the beginning. Maury found thousands of old ship logs gathering dust in the depot's archives. Instead of letting them rot, he and his assistants systematically analysed these logbooks, extracting daily records of ship positions, speeds, winds, and ocean currents. He soon became known as the "Pathfinder of the Seas" for his pioneering work in physical geography. By looking at historical data, he realised that the ocean was not a chaotic void, but a system governed by reliable laws.
What were Matthew Fontaine Maury's wind and current charts?
Maury compiled this vast amount of historical data into comprehensive wind and current charts, effectively mapping the invisible highways of the ocean. However, he knew that the archived logs were not enough. To fill gaps in his data, he created a standardised "abstract log" and offered his charts for free to any navigator who agreed to record and return data in this uniform format. This brilliant exchange created a global network of crowdsourced data, turning every commercial and naval voyage into a rigorous scientific observation.
He did not stop at winds and currents. By studying whaling logs, he also mapped the seasonal migrations of whales, creating detailed charts for the whaling industry. His data even helped confirm the existence of an ice-free Northwest Passage when he noticed that some whales killed in the Atlantic carried harpoons from Pacific ships, proving they had taken a shorter northern route across the Arctic.
How much time did Matthew Fontaine Maury's charts save?
Maury's charts allowed sailors to stop fighting the ocean and start using its prevailing winds and currents to their advantage. The results were dramatic and reshaped global trade.
New York to San Francisco: By 1851, ships using Maury's charts completed the voyage in an average of 144.5 days, a massive saving of over 40 days compared to the old average. The clipper ship *Flying Cloud* used his data to set a world record, making the brutal trip around Cape Horn in just 90 days.
New York to Rio de Janeiro: The *W. H. D. C. Wright*, the first ship to use his recommended "fair way" route, completed the trip in 38 days, saving 17 days.
The economic impact was staggering. The British government estimated that Maury's charts saved millions every year on Indian Ocean routes alone, changing navigation forever. His work proved that the most efficient way forward was to rigorously analyse the past.
How can students use Maury's method to study better?
Maury didn't discover new winds; he just looked at past data to find a better path. When preparing for high-stakes exams like the JEE Main or NEET-UG, students often sail without a chart. They take endless mock tests but fail to analyse their results, repeating the same types of errors and wasting valuable time.
If you treat your past mistakes like Maury treated ship logs, you can drastically cut down your study time. Instead of just checking your final score and moving on, log every single error you make in a dedicated notebook. Ask yourself if the mistake was due to a silly calculation error, a forgotten formula, or a fundamental concept gap. You might even find value in AI study plans: what they can do, and how to judge one to plot a better route through your syllabus.
Once you spot a recurring gap in your knowledge, you can address it systematically. For example, if you struggle with applying the right physics principles to unfamiliar scenarios, you can use the Fermi Problem Library to work through problems with a step-by-step solver that explains the reasoning rather than printing an answer.
By mapping out where you usually go wrong, you build your own "wind and current chart" for your studies, turning past struggles into a faster route to success. If you are ever stuck on a theoretical idea, the Concept Library holds every concept in physics, chemistry, biology, mathematics and computing, each with its own lesson and its place in the map. When you are tired, taking intentional time off is key—learn what to do in a study break, according to the research to recover faster and return with a clear mind.


