On this page
In 1994, the standard linear barcode hit a wall. Factories building cars needed to track parts as they moved down the line, but traditional barcodes could only hold a small amount of information (QRcode.com). Workers were stuck scanning multiple barcodes on a single part just to read its basic data.
Masahiro Hara, a developer heading a two-person team at Denso Wave (then a division of Denso Corporation), set out to build a code that could hold more data—including Kanji and Kana characters—and be read at high speed. The result was the Quick Response, or QR, code, capable of holding about 7,000 numerals (QRcode.com).
How do the finder squares work?
If a code holds data in two dimensions, a scanner needs to know which way is up. You cannot force a factory worker to hold a part perfectly straight, so the code had to be readable from any angle (360 degrees) (QRcode.com).
Hara’s solution was the position detection patterns: the three distinctive squares in the corners of every QR code.
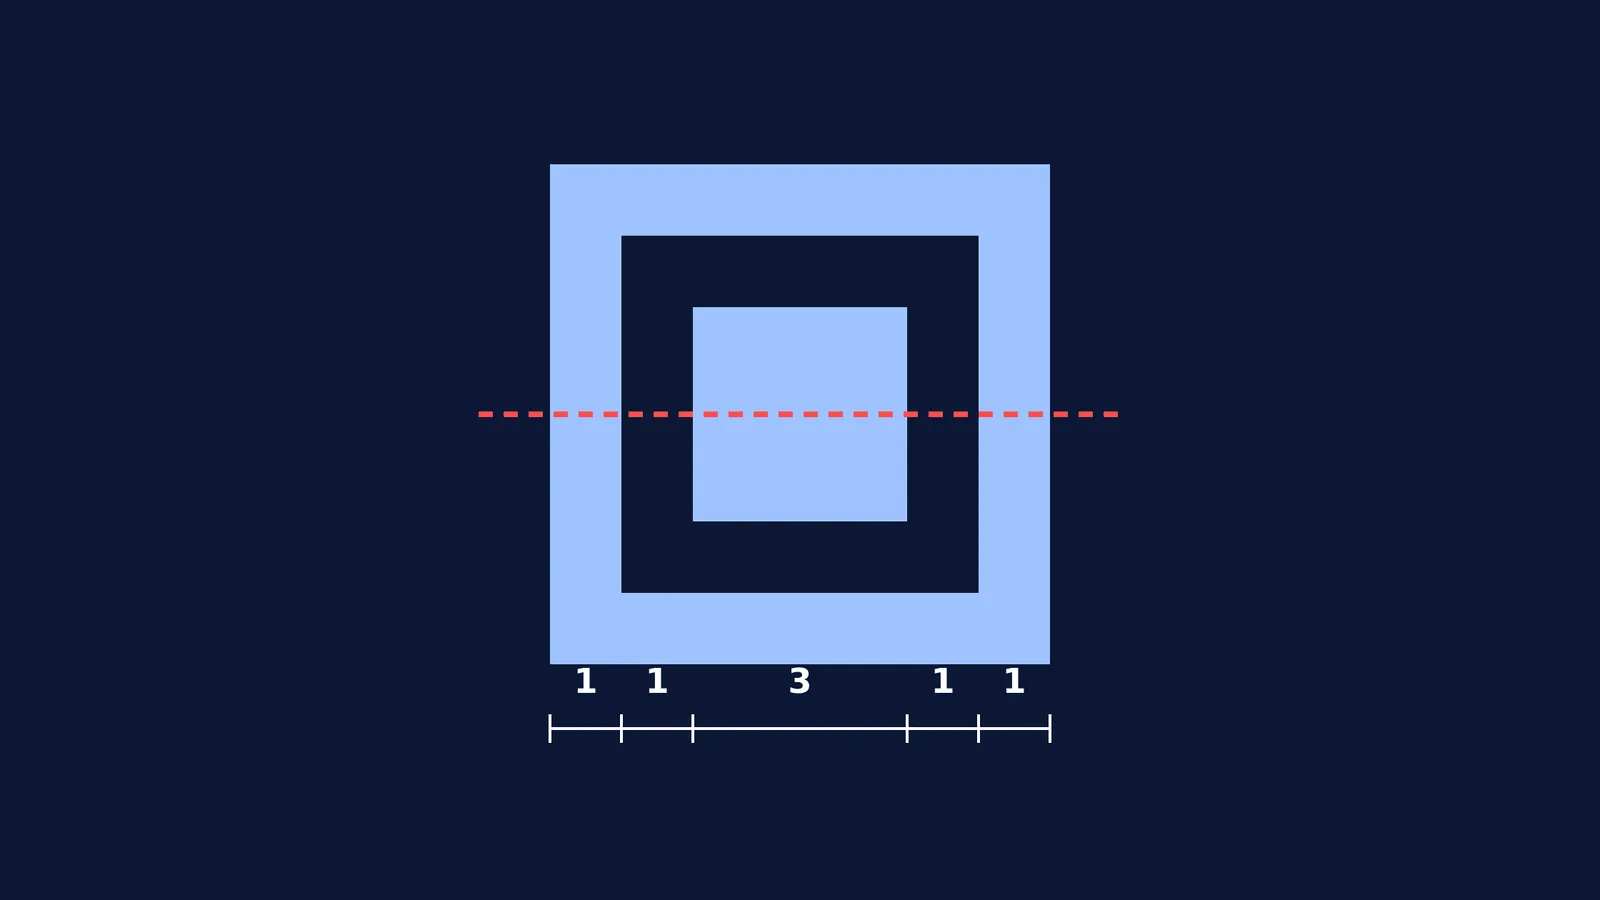
To ensure the scanner did not confuse these squares with regular text or logos on a package, the team spent exhaustive hours surveying printed matter. They found a specific ratio of black to white that almost never appears by chance in everyday print: 1 unit black, 1 unit white, 3 units black, 1 unit white, 1 unit black.
Worked Example: How the Scanner Finds the Code
A scanner's camera captures the image and looks for patterns of dark and light pixels.
It draws virtual lines across the image in multiple directions.
Whenever a line crosses a region that alternates black-white-black-white-black in exactly a 1:1:3:1:1 length ratio, the software registers a "hit".
By finding this ratio, the scanner identifies the center of a finder square. Once it locates three of these squares, it instantly locks onto the grid's size and orientation.
How did the QR code become a global standard?
Denso Wave originally built the QR code to track car parts, but the company's decision to freely share the standard allowed the technology to spread.
The first major wave of consumer adoption happened in Japan. By 2002, Japanese mobile phone manufacturers began integrating QR code readers directly into handset cameras (Wikipedia). This let users scan codes in magazines and on billboards to access websites without typing a URL on a keypad.
The second wave arrived during the COVID-19 pandemic. To minimize physical contact, restaurants replaced printed menus with QR codes, and countries mandated code scans for contact tracing and vaccination certificates (Wikipedia). What began as a tool for factory inventory became a critical piece of global infrastructure.
How does error correction restore data?
Factory floors are tough environments. A barcode on a car part might be covered in oil, scratched, or partially torn off. If a single line on an old 1D barcode is smudged, the entire scan fails.
To fix this, the QR code relies on Reed–Solomon error correction (Wikipedia). This mathematical technique treats the data as coefficients of a polynomial and adds redundant backup bytes, or codewords, into the grid. If some squares are unreadable, the scanner uses these backup bytes to mathematically reconstruct the missing data.
To prevent a single scratch from destroying an entire block of data, the codewords are interleaved, meaning they are shuffled across the physical grid. A localized smudge will only affect a few bytes in each mathematical block, rather than wiping out a whole sequence. (To see how early codes managed errors, read about Richard Hamming and the codes that fix their own errors).
There are four selectable levels of error correction, letting the user trade data capacity for durability (Wikipedia):
Level L (Low): Restores ~7% of data
Level M (Medium): Restores ~15% of data
Level Q (Quartile): Restores ~25% of data
Level H (High): Restores ~30% of data
The mathematics of data
Masahiro Hara’s invention merged a smart geometric trick (the 1:1:3:1:1 ratio) with rigorous mathematics (Reed-Solomon codes) to create a robust system that eventually spread far beyond the automotive industry. (If you want to understand how other early data structures were compressed, you can read about David Huffman and the term paper that taught data to shrink).
When you sit down to work through the logic of topics like matrices or data algorithms, Fermi's AI tutor can help. It works out what you already know, builds a plan for the session, and teaches through it — writing on a board, drawing the figure, running the simulation, and checking understanding as it goes.