On this page
The ozone hole is often told as a chemistry story: CFCs, chlorine and a global treaty. It is also a measurement story. A small team kept taking the same reading in Antarctica, year after year, and trusted it when it disagreed with what the models expected. Joe Farman led that team. This post covers what is on record about him, what the 1985 paper said, a worked example on ozone and ultraviolet light, and what you can learn from it.
Who was Joseph Farman?
Published records about Farman's life are brief. The Oxford Dictionary of National Biography entry is titled "Farman, Joseph Charles [Joe] (1930–2013), Antarctic geophysicist", and Physics Today published an obituary in 2013. His work, though, is well documented. With Brian Gardiner and Jonathan Shanklin of the British Antarctic Survey, he wrote the 1985 paper that announced the ozone loss.
How was ozone measured over Antarctica?
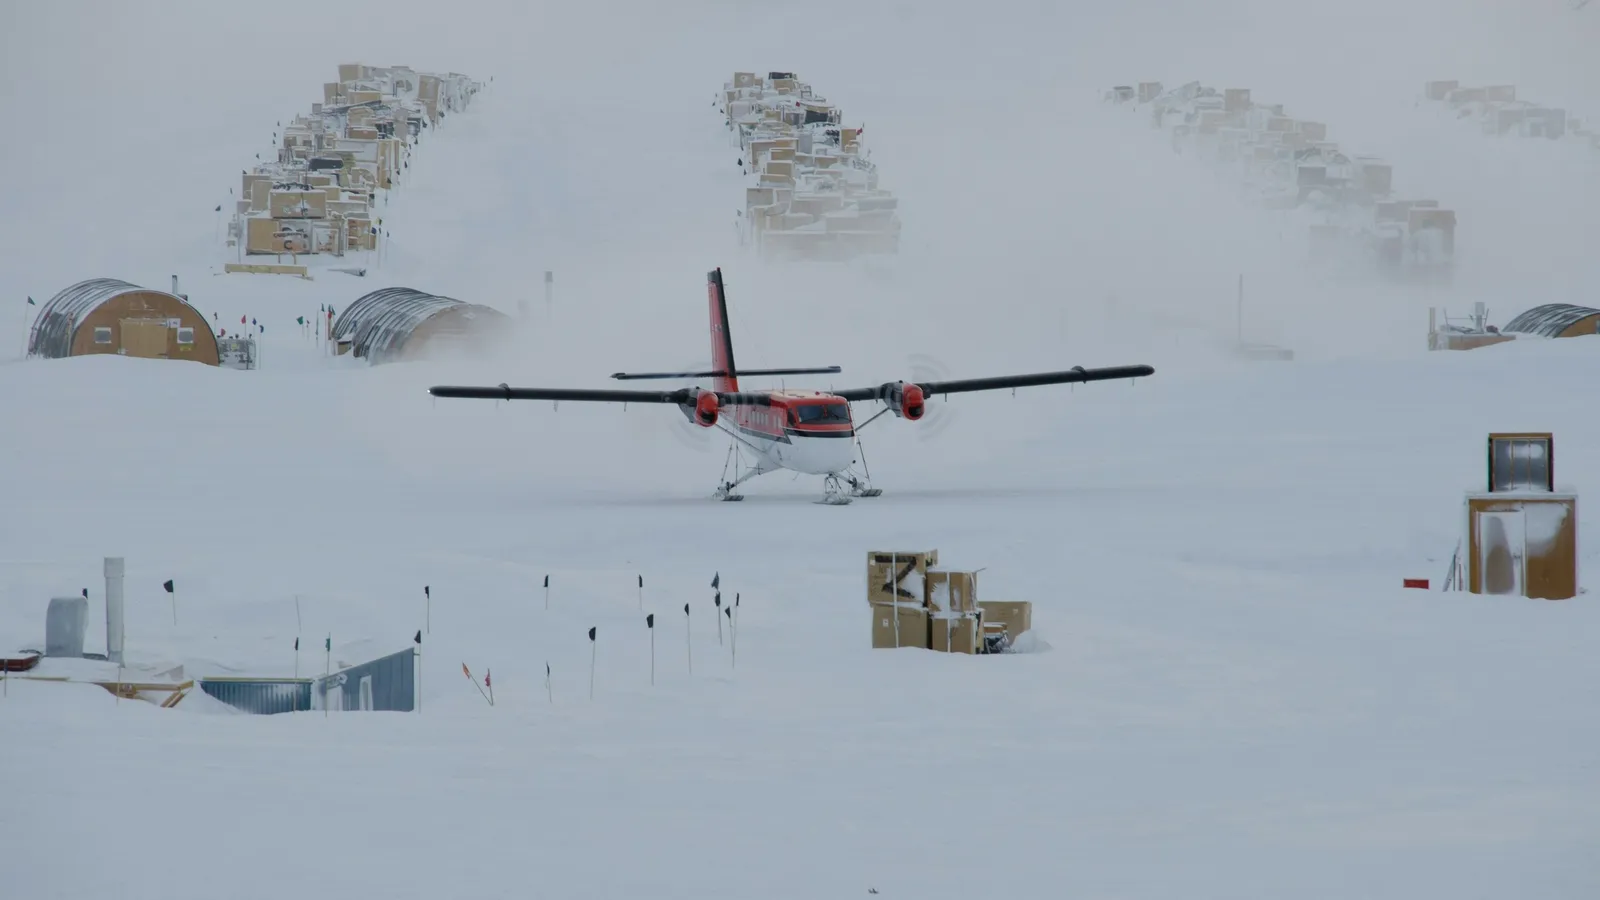
NOAA's Twenty Questions and Answers About the Ozone Layer: 2022 Update explains the instrument. A Dobson spectrophotometer measures the intensity of sunlight at two ultraviolet wavelengths, one strongly absorbed by ozone and one weakly absorbed. The difference gives the total amount of ozone above the instrument. A global network of such stations was set up in 1957 for the International Geophysical Year, including stations in Antarctica.
Total ozone is reported in Dobson units (DU). NOAA notes that 300 DU, close to the global average, would make a layer of pure ozone only about 3 mm thick at the Earth's surface.
What did the 1985 paper find?
The paper, Large losses of total ozone in Antarctica reveal seasonal ClOx/NOx interaction, appeared in Nature in May 1985. Its abstract makes a pointed argument. Assessments based on one-dimensional models for 30 degrees north had suggested that changes in total ozone would stay small for at least a decade, and such results were often accepted as global estimates. The authors wrote that the inadequacy of this approach was "here made evident" by observations that the spring values of total ozone in Antarctica "have now fallen considerably".
They found no sign that the circulation of the lower stratosphere had changed, so they looked to chemistry. They suggested that the very low temperatures from midwinter until several weeks after the spring equinox make the Antarctic stratosphere uniquely sensitive to growing inorganic chlorine.
NOAA's summary puts the result simply: the team linked rising CFCs to a steady decline in total ozone over the Halley Bay research station (76°S) during successive Octobers starting in the early 1970s. Early reports had also come from the Japan Meteorological Agency, but the Nature paper made the finding widely known. Satellite measurements soon confirmed it and showed that the depletion covered a large region centred near the South Pole.
Worked example: what does losing ozone do to UV?
Ozone absorbs ultraviolet light following the Beer-Lambert law: the fraction transmitted is T = e^(−kX), where X is the ozone amount and k depends on wavelength. The numbers below are sample values for one strongly absorbed wavelength, chosen to show the shape of the law.
Step 1: find k. Suppose a column of 300 DU lets through 10% of this light. Then 0.10 = e^(−300k), so k = ln(10) ÷ 300 ≈ 2.303 ÷ 300 ≈ 0.00768 per DU.
Step 2: thin the layer. NOAA uses 220 DU as the boundary of the ozone hole. T = e^(−0.00768 × 220) = e^(−1.69) ≈ 0.185.
Step 3: compare. 0.185 ÷ 0.10 ≈ 1.8. Ozone fell by (300 − 220) ÷ 300 ≈ 27%, but the ultraviolet reaching the ground at this wavelength nearly doubled. Exponential laws punish small losses.
Step 4: thickness check. At 3 mm for 300 DU, 220 DU is 220 × 0.01 mm = 2.2 mm of pure ozone.
The same exponential maths appears in radioactive decay and half-life.
What happened next?
The Montreal Protocol, which phases out the chemicals that deplete ozone, was signed in 1987 and entered into force in 1989. The chemistry of how chlorine destroys ozone is told in our post on Mario Molina. Ozone and its depletion over Antarctica also appear in NCERT's Class 11 chapter World Climate and Climate Change.
What mistakes do students make about the ozone hole?
Thinking it is a literal hole. It is a region where total ozone falls below about 220 DU.
Linking it mainly to global warming. It is caused by chlorine and bromine from human-made gases, with very cold polar clouds speeding the chemistry.
Assuming satellites found it first. NOAA's account credits ground-based Dobson measurements with the first published reports.
What can a student learn from Farman's way of working?
Keep careful records, repeat the same measurement the same way, and take your data seriously when it disagrees with the expected answer. Then look for the explanation instead of assuming the instrument is wrong. In your own lab work, that means recording every reading, not just the ones that look right.
If exponential relations like Beer-Lambert still feel shaky, the Fermi Problem Library has a step-by-step solver that explains the reasoning behind each line.
Try it now: repeat the worked example for a column of 150 DU.