

On this page
On 18 April 1906, just after 5:12 in the morning, the ground under San Francisco shook hard for 45 to 60 seconds, according to the US Geological Survey's account of the 1906 earthquake. The rupture ran along 477 km of the San Andreas fault, and the USGS notes that the often-quoted toll of 700 deaths probably undercounts the real loss of life by a factor of 3 or 4.
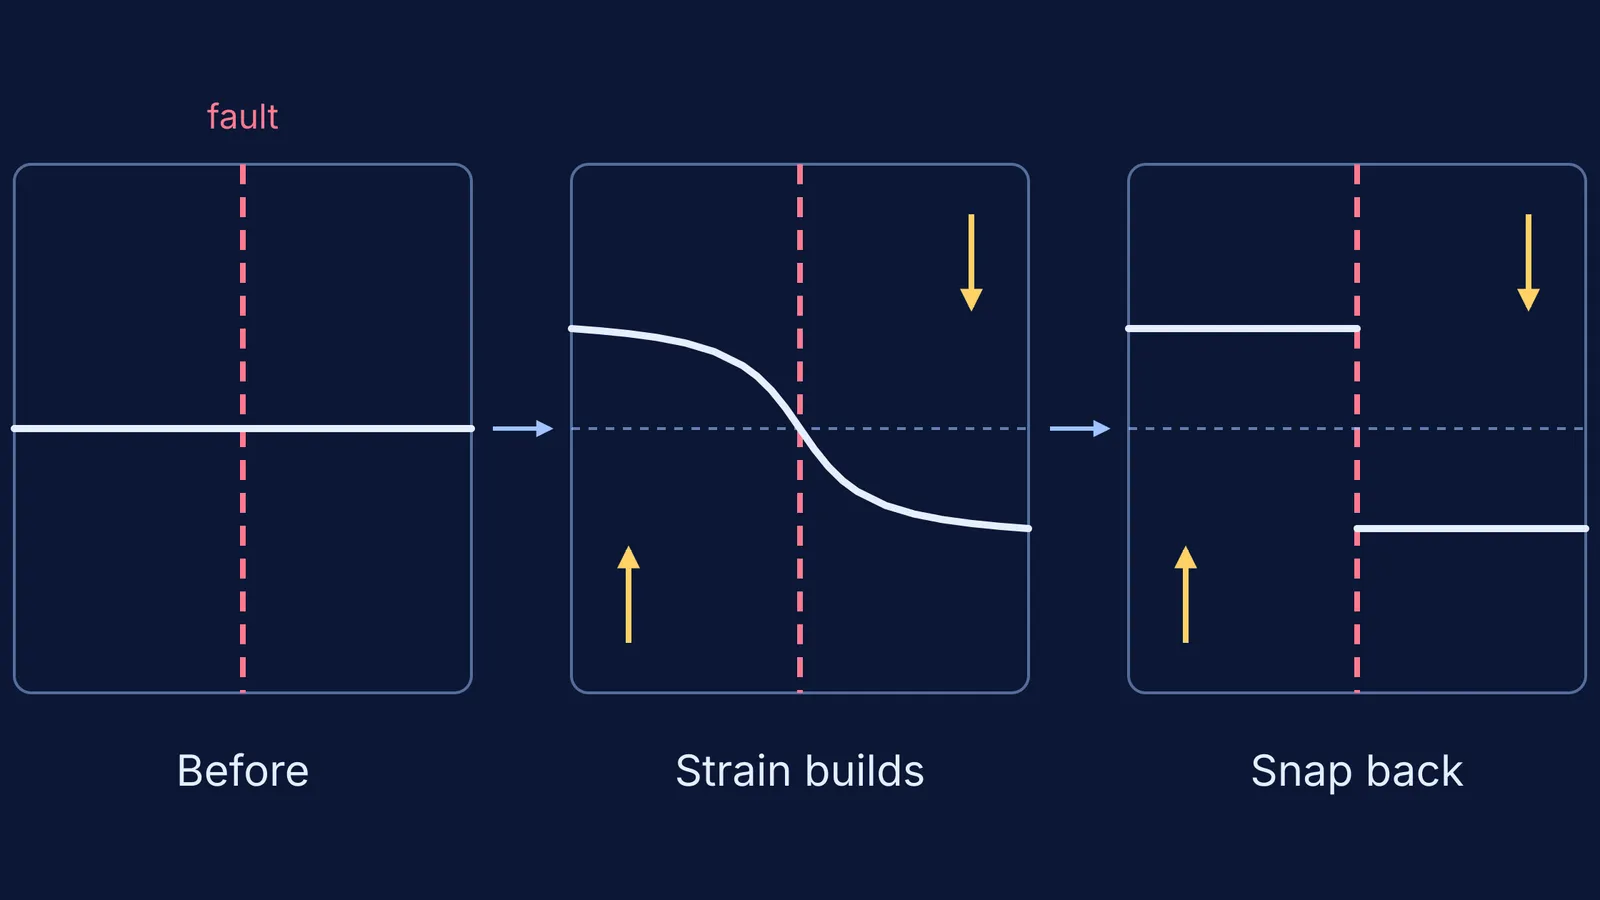
From that disaster, Harry Fielding Reid, a physicist turned geologist, worked out that rock behaves like a stretched spring: it bends slowly, stores energy, then snaps back.
Who was Harry Fielding Reid?
Reid was born in Baltimore on 18 May 1859 and died on 18 June 1944, according to the National Academy of Sciences biographical memoir by Andrew C. Lawson and Perry Byerly. He earned his doctorate at Johns Hopkins University in 1885, taught mathematics and physics in Cleveland, and returned to Johns Hopkins as Professor of Geological Physics in 1901.
Until 1907, the memoir says, he published almost entirely on glaciers. In 1906 Governor Pardee appointed him to the California State Earthquake Investigation Commission, and the earthquake "diverted him from glaciers to the study of stresses and movements in the earth's crust." Lawson and Byerly described him as, in many ways, "the first American geophysicist."
What did the 1906 San Francisco earthquake show?
Two kinds of evidence mattered. The first was on the surface, where things crossing the fault were shifted sideways. A fence near Bolinas in Marin County was offset by about 8.5 feet, as shown on the USGS page about Reid's elastic rebound work.
The second was hidden in old survey records. Surveyors had fixed benchmarks on both sides of the fault long before the earthquake and measured them again afterwards. As Robert Yeats explains in Living with Earthquakes in the Pacific Northwest/05%3A_Tectonic_Plates_Geologic_Time_and_Earthquakes/5.03%3A_Earthquake_Basics/5.3.07%3A_Measuring_Crustal_Deformation_Directly_Using_Tectonic_Geodesy), the benchmarks recorded the slow elastic deformation of the crust before 1906, and "after the earthquake, the benchmarks snapped back."
Reid put the two together. Land far from the fault kept moving while the fault stayed stuck, so the rock in between bent. When the fault slipped, the bent rock straightened.
What is the elastic rebound theory?
Elastic rebound theory is the idea that an earthquake is the sudden release of elastic strain that built up slowly in the rocks on either side of a fault (USGS).
Reid first stated the idea in the commission's Volume I in 1908 and developed it in Volume II, The Mechanics of the Earthquake, in 1910, according to the Lawson and Byerly memoir. The memoir says the theory ruled out, for the 1906 shock and probably for all shocks, the older idea that earthquake waves came from whole blocks of crust shifting, and made stored elastic strain the source of the energy.
The physics is the same as a spring obeying Robert Hooke's law: deform it and it stores energy. Strain is the change in a line's length divided by its original length, as UC Berkeley's seismology notes put it. For practice with numbers, work through stress, strain and Young's modulus problems.
Can elastic rebound predict the next earthquake?
In Yeats's account of the 1989 Loma Prieta forecast/05%3A_Tectonic_Plates_Geologic_Time_and_Earthquakes/5.07%3A_Memories_of_the_Future%3B_The_Uncertain_Art_of_Earthquake_Forecasting/5.7.11%3A_Forecasting_the_1989_Loma_Prieta_Earthquake%E2%80%94Close_But_No_Cigar), Reid reasoned that if you kept measuring the benchmarks, the next large earthquake would be close once the fault had stored as much strain as it released in 1906.
With made-up round numbers:
Find how much slip the last earthquake released: say 4 m.
Find how fast strain builds again, as slip per year: say 2 cm, or 0.02 m.
Divide: 4 m / 0.02 m per year = 200 years to store the same strain again.
The idea partly held up. Yeats notes that the 1989 Loma Prieta earthquake released much of the strain stored since 1906, as Reid had predicted, but no forecaster was confident enough to raise the alarm beforehand. Faults do not slip the same amount every time, so the division gives a rough window, not a date. To see how seismologists later put a number on an earthquake's size, read about Charles Richter and the logarithm behind earthquake magnitude.
How can you see elastic rebound for yourself?
You need a kitchen sponge and five minutes:
Cut the sponge in half and press the cut faces together on a table.
Draw a straight line across both halves: your fence.
Press the halves together while pushing them slowly in opposite directions.
Watch the line bend into an S near the cut.
Keep pushing until the halves slip. The line jumps into two straight, offset pieces.
Then ask yourself: where was the energy stored, what held the halves until they slipped, and does pressing harder give a bigger jump? If the bending is still hard to picture, the Fermi Simulation Lab has interactive simulations for ideas that are easier to see than to read, and the Fermi Concept Library covers every concept in physics, chemistry, biology, mathematics and computing, each with its own lesson.
Next time you read about an earthquake, look for the fault and ask how long it had been bending.


