

On this page
If you take a multiple-choice test about the state of the world, you will probably score worse than a chimpanzee guessing at random. This was the provocative claim made by Dr Hans Rosling, a Swedish physician and statistician who spent his life trying to cure global ignorance with data.
Through the Gapminder Foundation, Rosling built animated tools to turn dry international statistics into moving, colour-coded stories. His goal was to dismantle the "dramatic worldview" that makes us believe the world is constantly getting poorer, sicker, and more dangerous.
What is a Gapminder bubble chart?
The tradition of drawing data to reveal patterns began with William Playfair and the bar chart, but Rosling added the dimension of time. His most famous tool, the Gapminder World Chart, plots nations as bubbles moving across a grid from 1800 to the present day.
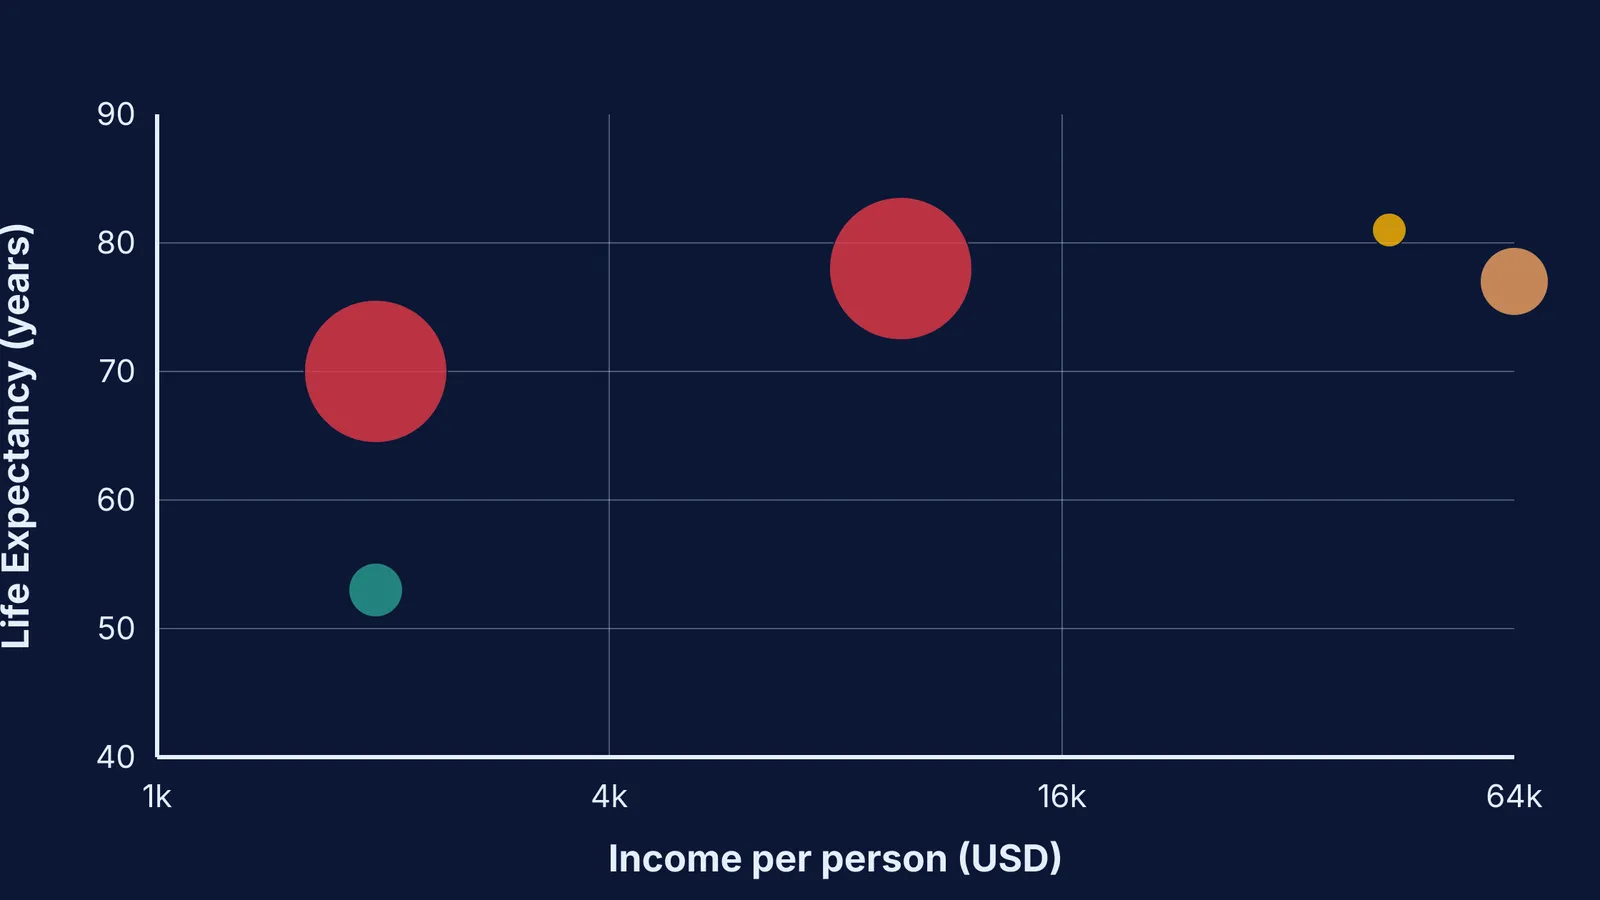
The chart relies on four distinct variables:
The X-axis shows wealth: Income per person is plotted on a logarithmic scale. This means each step on the axis doubles the income (e.g., 1,000 USD to 2,000 USD, then 2,000 USD to 4,000 USD), reflecting that an extra 1,000 USD matters much more to a poor family than a rich one.
The Y-axis shows health: This is usually measured by life expectancy at birth.
The bubble size: The area of each circle represents the country's population.
The bubble colour: Countries are colour-coded by geographic region, making it easy to track entire continents at a glance.
When the animation plays, the bubbles migrate from the bottom-left (poor and sick) to the top-right (rich and healthy). Rosling famously presented these animations like live sports commentary, enthusiastically tracking the "race" of developing nations. Just as John Tukey and the box plot showed statisticians how to look at data before testing it, Rosling wanted the general public to literally *see* global progress.
Visualising data dynamically is a powerful way to understand complex systems. If you want to experiment with interactive simulations yourself, try the Fermi Simulation Lab.
Why do humans score worse than chimpanzees?
In 2017, the Gapminder Foundation tested 12,000 people across 14 countries with 12 basic questions about global trends (Gapminder Test 2017). Because each question had three choices, a chimpanzee picking answers at random would statistically get 33% correct. The human respondents scored an average of just 2.2 out of 12 correct answers.
The survey questions covered fundamental facts: What percentage of girls in low-income countries finish primary school? (Answer: 60%). Where does the majority of the world's population live? (Answer: Middle-income countries). How many of the world's one-year-olds have been vaccinated? (Answer: 80%).
Even audiences of highly educated professionals, including investment bankers and Nobel laureates, systematically failed the test. Rosling argued this was not mere ignorance, but a systematic bias. We consistently choose the most pessimistic answer because our brains are wired for drama. These cognitive blind spots trick us into ignoring steady improvements, much like the famous case of Abraham Wald and survivorship bias.
How do health and wealth change together?
The bubble charts effectively dismantled the myth of the "developing" versus the "developed" world. The data shows that this binary gap no longer exists; the vast majority of the world's population now lives in middle-income countries.
According to World Bank data, the global average life expectancy in 1960 was roughly 51 years (World Bank). By 2020, this global average had risen to 72.2 years.
Rosling's animations revealed a crucial sequence: health usually precedes wealth. The bubbles for countries like China and India shot upward on the Y-axis (gaining decades of life expectancy through basic public health and vaccines) long before they moved rightward on the X-axis (growing their economies).
This sequence changed how economists viewed global progress. Instead of wealth being the sole driver of health, basic public health interventions often laid the foundation for economic booms. By extending life expectancy and reducing child mortality, nations created the stable demographics necessary for robust economic growth.
Plotting multiple variables can be tricky for students. If you need a step-by-step solver that explains the reasoning, try the Fermi Problem Library.
How can you test your own worldview?
In his book *Factfulness*, Rosling warned against ten dramatic instincts that distort our perception. To think more like a statistician and less like a panicked news consumer, use this practical framework:
Control the gap instinct: When you hear about two extremes (the richest and the poorest), remember that the vast majority is usually in the middle.
Expect both bad and better: A situation can be objectively bad, but still getting better over time. Both facts can be true at once.
Look for the denominator: Never accept a lone number. If you see a terrifying death toll, always ask what the total population is and compare it to historical rates.
Check the axis and the line: Be careful when reading charts. A straight line on a logarithmic scale actually represents exponential growth, and many trends (like population growth) level off rather than climbing forever.


