On this page
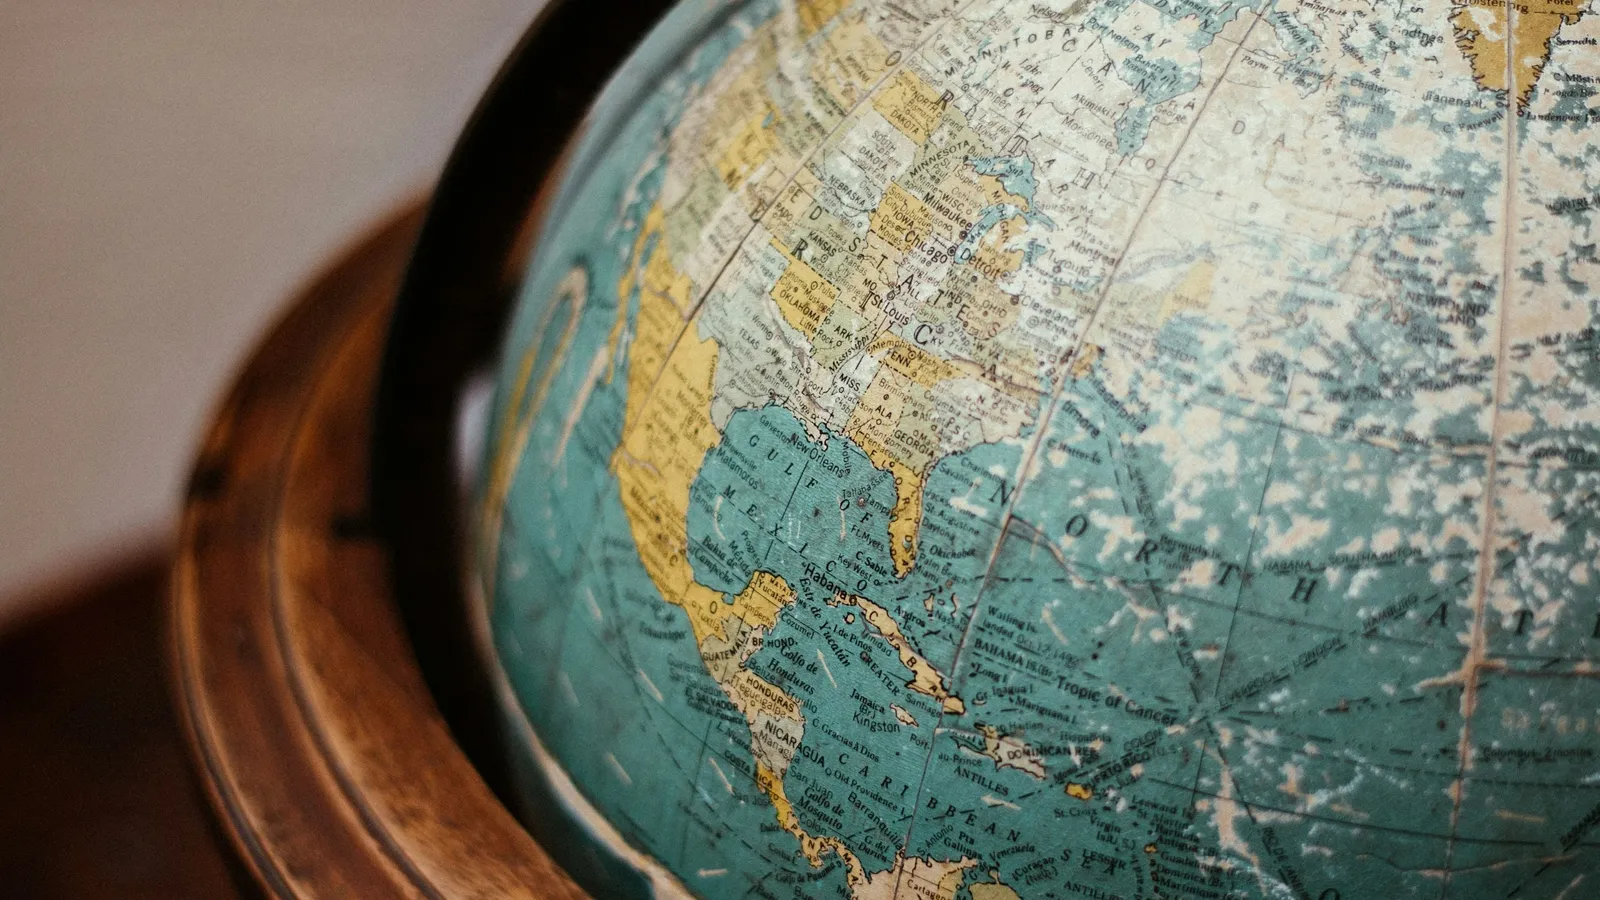
On many classroom world maps Greenland looks about as big as South America. In fact, according to the US Geological Survey, it is only about one-eighth the size. The distortion is not a mistake. It is the price of a choice Gerardus Mercator made deliberately in 1569, to help sailors. This post covers what he wanted, the maths that makes it work (an integral from JEE Main), and how to get the numbers in your NCERT geography table.
Who was Gerardus Mercator?
The USGS manual Map Projections: A Working Manual by John P. Snyder gives a short history. Mercator lived from 1512 to 1594. He was born at Rupelmonde in Flanders and was probably first named Gerhard Cremer or Kremer, but always used the Latin form. Snyder notes he was known in his time for maps, globes and calligraphy, was the first to use the word "atlas" for a book of maps, and first named North America on a map, in 1538.
The NCERT Class 11 book Practical Work in Geography, chapter 4 Map Projections calls him a Dutch cartographer. Rupelmonde is in Flanders, in present-day Belgium.
What problem was he solving?
A sailor in the 1500s steered by compass. The simplest course was to hold one bearing, say north-east, for the whole voyage. On a globe that path, called a rhumb line or loxodrome, spirals towards the pole. On ordinary maps of the time it was a curve, so a navigator could not draw the course with a ruler.
Snyder quotes Mercator's own explanation from the Latin panel on the 1569 map, in an English translation by Fite and Freeman. Mercator says earlier maps were "unsuitable for navigation" because of the curving meridians, and continues: "we have somewhat increased the degrees of latitude toward each pole, in proportion to the increase of the parallels beyond the ratio they really have to the equator."
The map was titled, in translation, "A new and enlarged description of the Earth with corrections for use in navigation". Snyder says it was made of 21 sections totalling about 1.3 by 2 metres.
Why does stretching the latitudes work?
On a globe of radius R, the parallel at latitude φ is a circle of circumference 2πR cos φ. On Mercator's map every parallel is drawn as long as the equator. So each parallel is stretched sideways by a factor of 1/cos φ = sec φ.
To keep angles correct, every small piece of the map must be stretched by the same factor in both directions. So the north-south spacing must also grow by sec φ. Adding up those small steps from the equator gives
y = R ∫₀^φ sec φ dφ = R ln(sec φ + tan φ)
Snyder gives this same formula (written as R ln tan(45° + φ/2)) and the scale factor sec φ. He adds that Mercator probably set the spacing by drawing, since secant tables did not yet exist, and that Edward Wright published the mathematics, with tables of cumulative secants, in 1599.
Worked example: the NCERT table and the area error
The JEE (Main) 2026 syllabus lists integrals involving trigonometric functions, so ∫ sec φ dφ = ln|sec φ + tan φ| + C is fair game. Use it for the map, with R = 1 unit.
At φ = 60°: sec 60° = 2 and tan 60° = 1.732. So y = ln(3.732) = 1.317. The NCERT table for Mercator's projection gives 1.317 for 60°.
Compare with the globe: the true distance along the meridian is Rφ in radians, 60° = 1.047. The map puts 60° N at 1.317, about 26% further from the equator.
At φ = 75°: sec 75° = 3.864 and tan 75° = 3.732, so y = ln(7.596) = 2.028. NCERT lists 2.027, the same to rounding.
Area at 60°: both directions are stretched by sec 60° = 2, so areas look 2 × 2 = 4 times too big.
Area at 72°: sec 72° = 3.236, so areas look 3.236² ≈ 10.5 times too big. Lands this far north look huge.
Near India, at 20°: sec 20° = 1.064, so areas look only 1.064² ≈ 1.13 times too big.
Common mistakes:
Using degrees where radians are needed in step 2.
Thinking a rhumb line is the shortest route. Snyder notes it is usually longer than the great circle path, which is the shortest route on a sphere.
Imagining the map as light shone from the centre of the globe onto a cylinder. Snyder states there is no suitable geometric construction for the Mercator projection.
For integrals like ∫ sec φ dφ, the Fermi Problem Library has a step-by-step solver that explains the reasoning rather than printing an answer. Our guide to integration by substitution covers the method behind it.
Is the Mercator projection still used?
Yes. Snyder writes that it has been standard for US nautical charts since 1910, and that the USGS has used it to map equatorial regions of the Moon, Mars and other bodies. He also warns that its area distortion gives students mistaken ideas when it is their main world map. For the much older problem of fitting a round Earth onto flat pages, see our post on Ptolemy's Almagest.
What can a student take from Mercator's way of working?
Decide what matters most. He chose straight compass courses and accepted the cost.
State the trade-off openly. His map explained its own stretching on its face.
Good ideas can outrun the maths. He drew it before anyone could calculate it; Wright supplied the formula 30 years later.
Next step: compute y for 30° and 45° with the formula and check them against the NCERT table (0.549 and 0.881).