On this page
On 28 October 1891 a magnitude 8.0 earthquake struck the Nobi region of central Japan. It caused 7,273 deaths and totally collapsed more than 140,000 houses, Japan's Headquarters for Earthquake Research Promotion records. Then the ground kept shaking, for years. A young physicist, Fusakichi Omori, counted those aftershocks and found a pattern seismologists still use.
Who was Fusakichi Omori and what did he find?
Omori, born in Fukui in 1868, studied physics at Tokyo Imperial University, where he learned from John Milne, the British seismograph pioneer. He later became the university's second chairman of seismology, according to his biography.
His 1894 work is described in a centenary review by Tokuji Utsu, Yosihiko Ogata and Ritsuko S. Matsu'ura in the Journal of Physics of the Earth. Omori studied the half-day and monthly counts of felt aftershocks after the Nobi earthquake and two other Japanese earthquakes. He first tried an exponential curve, but it fitted poorly. In papers from 1900 and 1902 he reported that his formula fitted the Nobi aftershocks for as long as ten years after the main shock.
What is Omori's law?
Omori's law says the rate of aftershocks falls roughly as the inverse of the time since the main shock, written n(t) = K / (t + c) in the Utsu, Ogata and Matsu'ura review. Here n(t) is aftershocks per unit time, K sets the size of the sequence, and c is a small offset that stops the formula blowing up at t = 0.
When t is much bigger than c, the rate is simply proportional to 1/t. As USGS seismologist Lucile Jones put it for Caltech: the second day has about 1/2 the number of aftershocks of the first day, and the tenth about 1/10.
Seismologists also use the modified Omori formula, n(t) = K / (t + c)^p. The centenary review found that it generally describes aftershock sequences well, with p usually between 0.9 and 1.5 depending on the sequence.
How fast do aftershocks decrease in a real sequence?
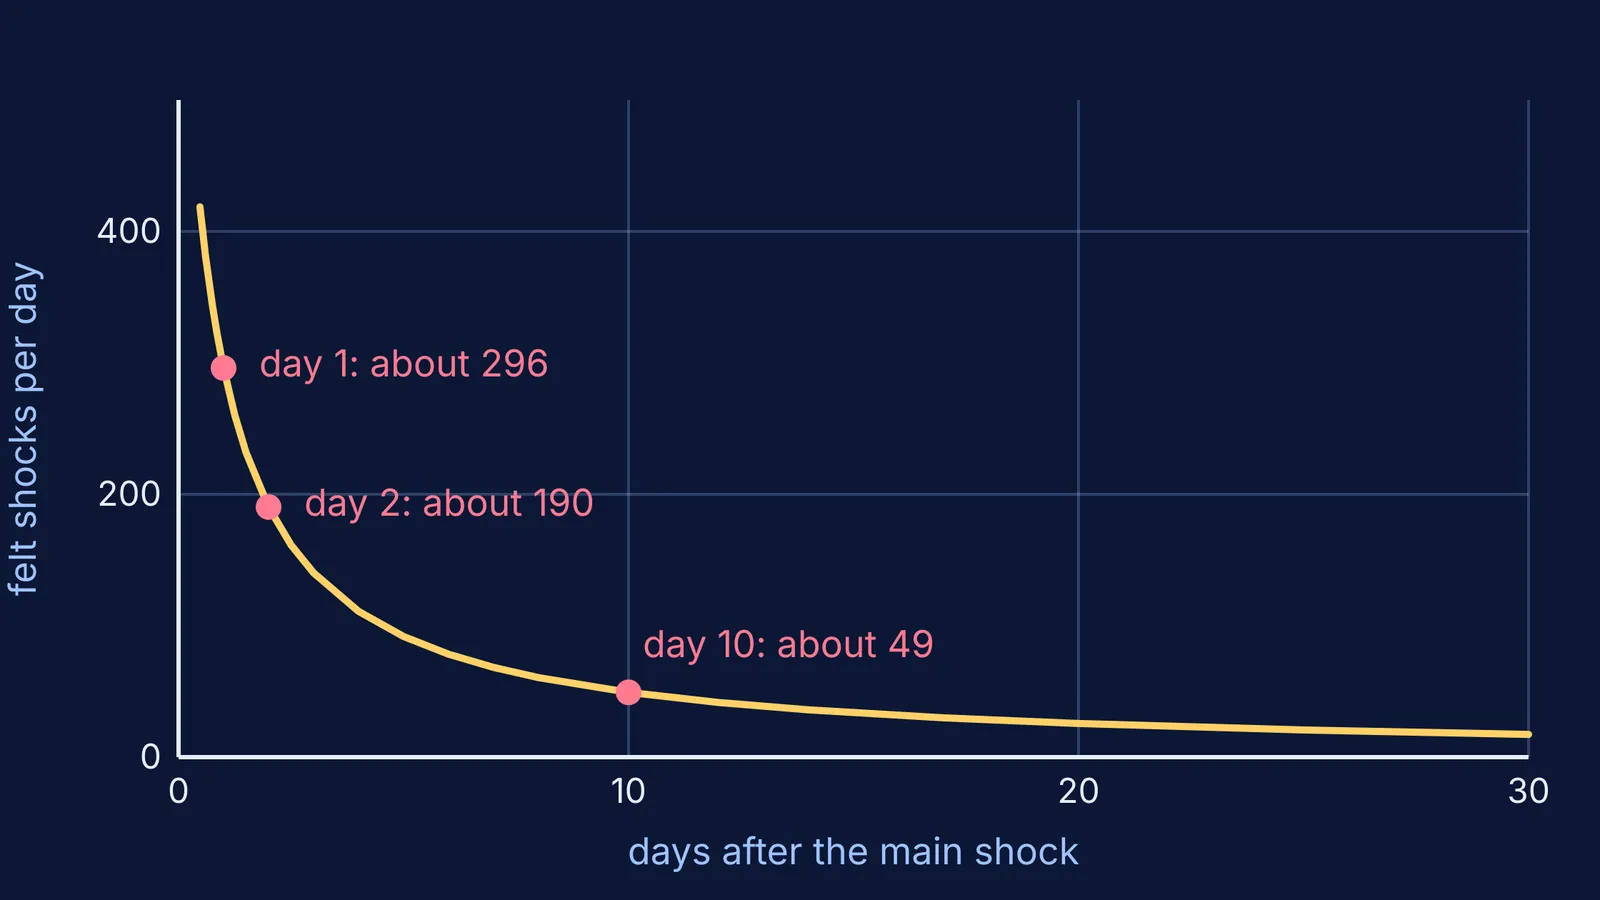
The review fitted the formula to 5,464 felt shocks counted at Gifu, a city inside the aftershock zone, from 0.474 days after the main shock up to 1991 (review, Figure 1). With p fixed at 1, they got K = 532.16 and c = 0.797 day.
Put in t in days and you get felt shocks per day:
t = 1 day: 532.16 / 1.797, about 296 per day
t = 2 days: about 190 per day
t = 10 days: about 49 per day
t = 100 days: about 5 per day
t = 1,000 days: about 0.5 per day
To count whole days, integrate: the number between day a and day b is K × ln((b + c) / (a + c)). The first day comes out at about 433 felt shocks, the second about 235 and the tenth about 52: close to the rule of thumb.
Why don't aftershocks decay exponentially like radioactivity?
A radioactive sample halves every half-life, a fixed stretch of time (see radioactive decay and half-life). The centenary review notes that Omori's power law instead implies long-lived activity, unlike the exponential function in most decay laws in physics.
In the Gifu fit, days 10 to 20 hold about 349 felt shocks, days 100 to 200 about 367, and days 1,000 to 2,000 about 369. Every doubling of time holds roughly the same number, K × ln 2, or about 369.
USGS seismologist Andrew Michael made this point in Seismological Research Letters: when the time window grows in proportion to t, "the rate decrease is canceled by the increase in the window duration."
What doesn't Omori's law tell you?
When the next shock comes. It gives an average rate, not the timing of any single shock.
How big they will be. The Caltech answer notes that the gap between a main shock and its largest aftershock ranges from 0.1 to 3 or more magnitude units, but averages 1.2. After Nobi, the largest were two aftershocks of magnitude 6.0. Magnitude is itself a logarithmic scale, explained in Charles Richter and the logarithm behind earthquake magnitude.
That it is over. The USGS says aftershocks "become less frequent with time, although they can continue for days, weeks, months, or even years for a very large mainshock."
How can you practise with Omori's law?
Omori's law uses three ideas from school maths: the graph of 1/x, logarithms, and the integral of 1/x. Work out n(t) for t = 10, 100 and 1,000 days, then plot them on log-log axes: they should lie close to a straight line of slope -1, as in the review's Figure 1.
If ln or integrating 1/x feels shaky, the Fermi Concept Library has its own lesson for every concept in mathematics and physics. For practice with integrals like these, the Fermi Problem Library has worked problems with a step-by-step solver that explains the reasoning rather than printing an answer.
Next time the news reports aftershocks, you will know why they keep coming, and why there are fewer each day.