

On this page
Before the 19th century, naval logbooks were full of subjective weather notes. One sailor's "stiff breeze" was another's "moderate gale", making it difficult to share reliable weather data across fleets. If a captain recorded that a storm was brewing, the admiralty had no way to know exactly how strong the wind was, or if the ship was in true danger.
Who made the Beaufort wind scale?
The Beaufort scale was devised in 1805 by Francis Beaufort, an Irish-born hydrographer and Royal Navy officer [[1]](https://en.wikipedia.org/wiki/Francis_Beaufort). While commanding the HMS *Woolwich*, he recognised that weather logs needed a standard language. Instead of relying on feelings or estimating the wind's speed—which they could not measure accurately on a moving ship—his system defined the wind entirely by what it did.
Beaufort's original scale had 13 classes, ranging from 0 to 12 [[2]](https://en.wikipedia.org/wiki/Beaufort_scale). It focused entirely on a full-rigged frigate, which was the standard Royal Navy ship of the era. Force 1 was described as "just sufficient to give steerage", meaning the ship could barely turn. At the upper limit, Force 12 was a wind "that which no canvas sails could withstand", meaning the crew had to take down all sails to survive the storm.
Because it relied on clear physical evidence, the scale removed the guesswork from weather logging. If a specific sail had to be reefed in, the wind was a specific force. The Royal Navy officially adopted the Beaufort scale in 1838, and it became a mandatory part of ship logs [[1]](https://en.wikipedia.org/wiki/Francis_Beaufort). It was even used during the famous voyage of the HMS *Beagle*, which carried Charles Darwin across the globe.
How is the Beaufort scale used today?
As steamships replaced sailing vessels, the old descriptions based on frigate sails became obsolete. In the 20th century, meteorologists updated the scale, adding descriptions for sea states—such as wave heights and foaming crests—and observable effects on land [[2]](https://en.wikipedia.org/wiki/Beaufort_scale). Today, maritime forecasts around the world, including those from the UK's Met Office, still rely on the Beaufort scale. In these modern forecasts, Force 0 represents calm winds under 1 knot, while Force 12 marks hurricane conditions at 64 knots or more [[3]](https://www.metoffice.gov.uk/weather/guides/coast-and-sea/beaufort-scale).
For those on land, the modern descriptions provide an easy way to gauge the weather without an anemometer [[2]](https://en.wikipedia.org/wiki/Beaufort_scale):
Force 0 (Calm): Smoke rises vertically in the air.
Force 2 (Light breeze): You can feel the wind on your face, leaves rustle, and ordinary wind vanes move.
Force 4 (Moderate breeze): The wind raises dust and loose paper from the ground, and small branches move.
Force 6 (Strong breeze): Large branches are in motion, and you will hear a whistling sound in telegraph or power wires. Using an umbrella becomes difficult.
Force 8 (Gale): Twigs break off trees, and walking outside is generally impeded.
Force 10 (Storm): Trees are uprooted, and considerable structural damage occurs to buildings.
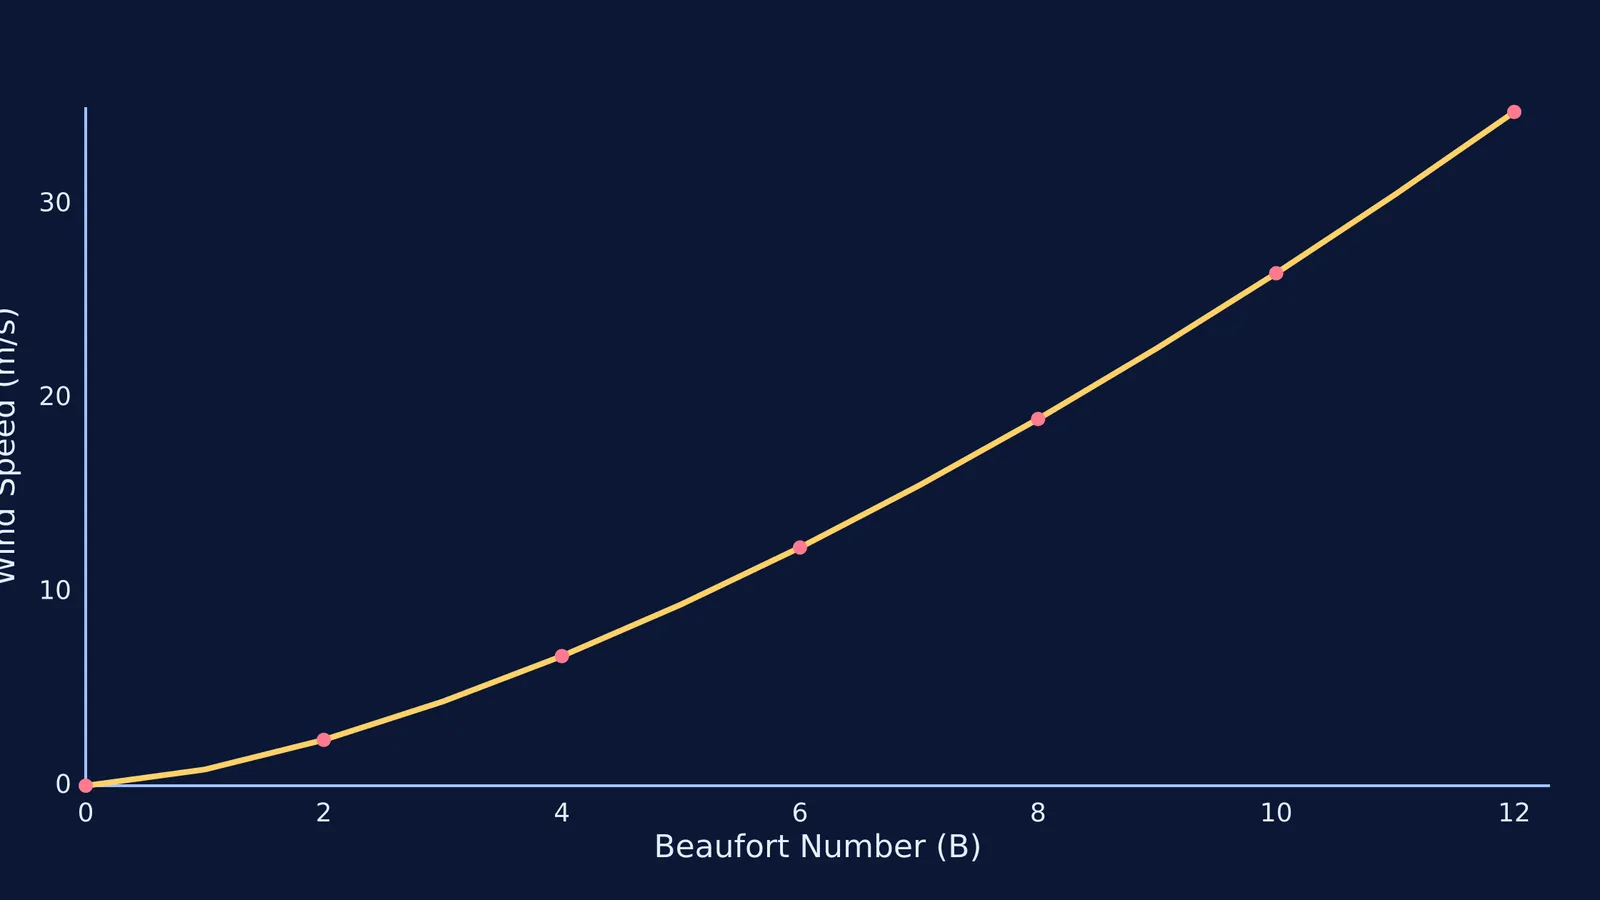
In modern physics and meteorology, the empirical Beaufort number (*B*) is now formally linked to the measured wind speed (*v*) at 10 meters above the ground. The speed in meters per second is calculated as v = 0.836 × B^(3/2) [[2]](https://en.wikipedia.org/wiki/Beaufort_scale). Translating an empirical observation into a measurable mathematical quantity is a core skill in science. If you are struggling to connect real-world scenarios to equations in your studies, the Fermi Problem Library has worked problems with a step-by-step solver that explains the reasoning rather than printing an answer.
How can you use observation in your studies?
Beaufort's approach—defining a standard by what you can see and feel—is exactly how you should approach learning early physics. Before you start plugging numbers into a formula, you need to build a physical intuition for the problem. This prevents you from accepting mathematically correct but physically impossible answers.
Look for the physical effect: If a mechanics problem describes a block sliding down a ramp, think about what is stopping it. Imagine the friction you would feel pushing a heavy box across a floor.
Define your own anchors: Just as Beaufort knew exactly what a "moderate gale" did to a frigate's sails, you should know what common physical values feel like. You know what the acceleration of a dropping object looks like, so you can instantly spot when an exam calculation for a falling apple is physically impossible.
Connect the qualitative to the quantitative: Once you have a feeling for the scale of the forces, then apply the equations. Start with the physical reality, then move to the algebra.
Understanding the atmosphere relies heavily on careful observation. To see how other scientists built models from raw data, you can read about how Vilhelm Bjerknes and the physics of weather forecasting mapped the air, or how Henry Blanford and India's first monsoon forecast turned early meteorological records into reliable predictions.


