On this page
Why should anyone care if a grassland loses a few plant species? NCERT's biodiversity chapter answers with one name: David Tilman, whose outdoor plots in Minnesota put numbers on the question. This post covers who he is, what his experiments found, and how to calculate the kind of stability measure his work relies on.
Who is David Tilman?
The citation for his 2014 Balzan Prize in plant ecology says Tilman was born in the United States and did his undergraduate degree and PhD at the University of Michigan. He has been on the faculty of the University of Minnesota since 1976. It describes his theory of plant resource competition, which showed how several plant species might coexist or exclude each other while competing for a few essential resources. To test those ideas he set up large experiments at the Cedar Creek Ecosystem Science Reserve, owned by the University of Minnesota.
That question, coexistence versus exclusion, is the one Georgy Gause asked in test tubes. See our post on Georgy Gause and competitive exclusion.
What did the drought show?
In 1994 Tilman and John Downing reported in Nature on biodiversity and stability in grasslands. Their long-term study found that primary productivity in more diverse plant communities was more resistant to, and recovered more fully from, a major drought. The relationship was curvilinear: each additional species lost had a progressively greater impact on drought resistance. The authors concluded that their results supported the diversity-stability hypothesis.
Do more species mean more growth?
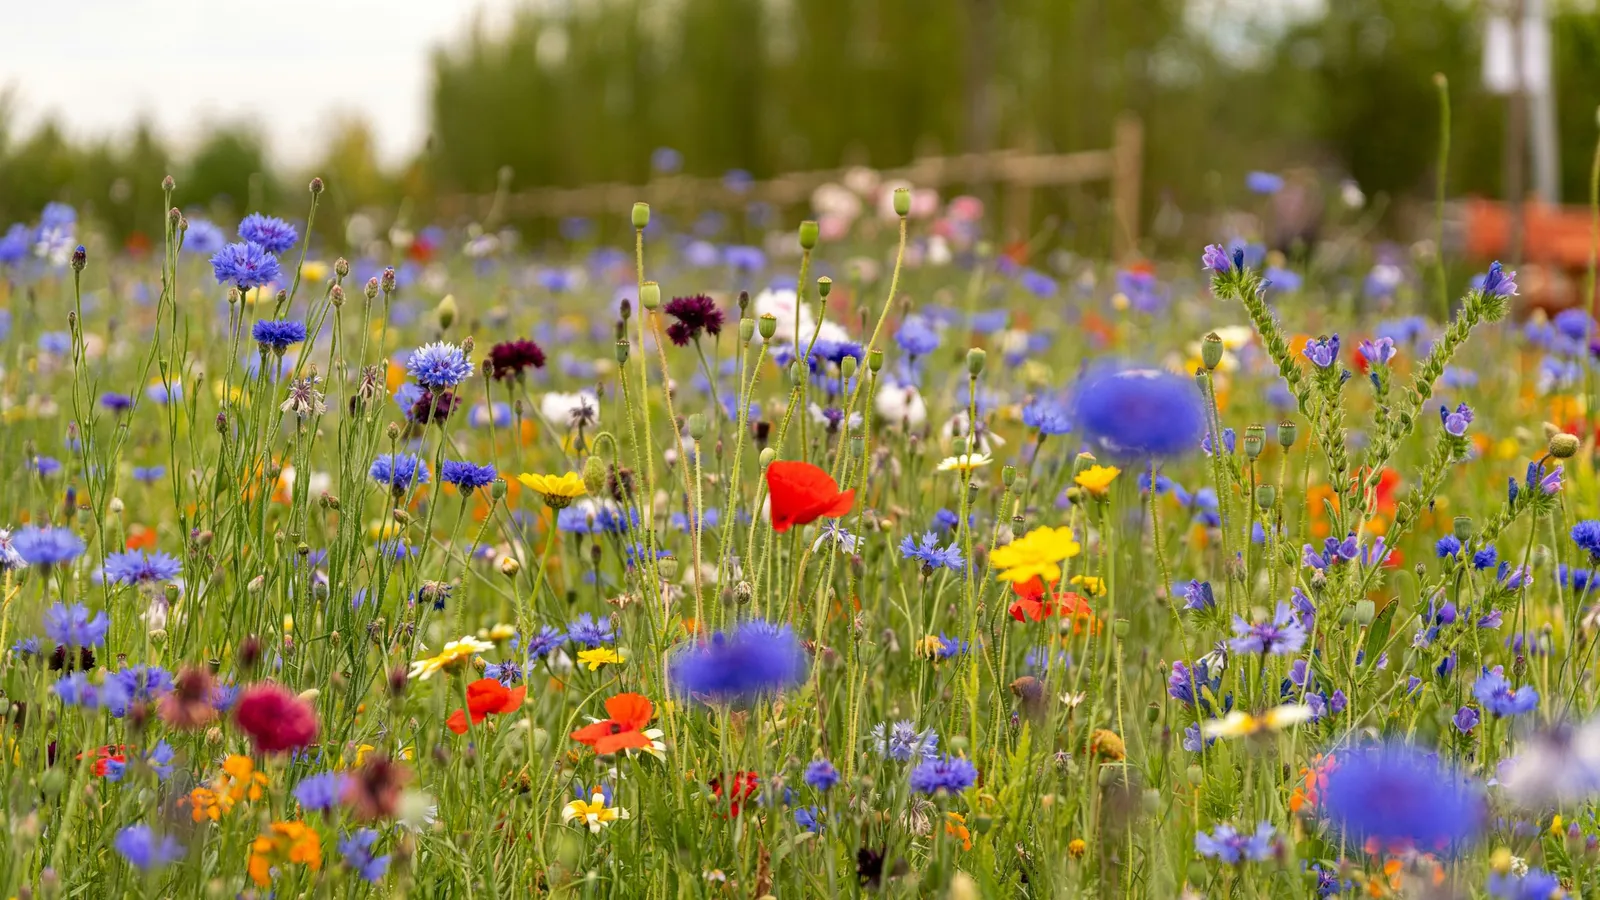
In 1996, with David Wedin and Johannes Knops, Tilman reported a well-replicated field experiment in which the number of plant species was directly controlled. Across 147 grassland plots, productivity rose significantly with plant diversity. More diverse plots also used the main limiting nutrient, soil mineral nitrogen, more completely, so less nitrogen leached away.
In 2001 a Science paper by Tilman and colleagues reported that these effects grew stronger over a seven-year experiment, with 16-species plots reaching 2.7 times the biomass of monocultures. Many higher-diversity plots outperformed even the highest-yielding single-species plot. The Balzan citation names the mechanism: niche complementarity, where species use resources in different ways so that together they use more of what is available.
NCERT's Class 12 chapter on biodiversity sums it up: Tilman found that plots with more species "showed less year-to-year variation in total biomass" and that "increased diversity contributed to higher productivity". NCERT calls these "tentative answers".
A worked example: measuring stability
The numbers are invented for practice, not Tilman's data. Two plots are harvested in four years. Biomass in grams per square metre:
Plot A, one species: 300, 150, 350, 200
Plot B, sixteen species: 480, 420, 500, 440
Stability is often judged by the coefficient of variation (CV): the standard deviation divided by the mean.
Mean of A = (300 + 150 + 350 + 200)/4 = 1000/4 = 250.
Deviations of A: 50, −100, 100, −50. Squares: 2500, 10000, 10000, 2500. Mean of squares = 25000/4 = 6250. Standard deviation = √6250 ≈ 79.1.
CV of A = 79.1/250 ≈ 0.316, about 32%.
Mean of B = (480 + 420 + 500 + 440)/4 = 1840/4 = 460.
Deviations of B: 20, −40, 40, −20. Squares: 400, 1600, 1600, 400. Mean = 4000/4 = 1000. Standard deviation = √1000 ≈ 31.6.
CV of B = 31.6/460 ≈ 0.069, about 7%.
Plot B varies far less relative to its size. Check against the 2.7 figure too: if a monoculture averaged 200 g/m², a plot with 2.7 times the biomass would reach 2.7 × 200 = 540 g/m².
Common mistakes:
Comparing standard deviations alone. A bigger plot can have a bigger standard deviation and still be steadier. Divide by the mean.
Forgetting to square the deviations. They add to zero otherwise.
Reading correlation as cause in field surveys. Tilman controlled species numbers directly, which is why his plots say more than a survey of natural meadows. Our guide to mean and variance covers the formulas.
What can a student take from his way of working?
Design the experiment so the answer is clear. Tilman set species numbers himself instead of relying on whatever grew.
Be patient. The productivity effect grew stronger over seven years.
Link theory and fieldwork. His competition theory came first, then the plots that tested it.
If standard deviation still feels like a formula with no meaning, the Fermi Problem Library has worked problems with a step-by-step solver that explains the reasoning behind each step.
Try it now: invent four years of biomass for a two-species plot and calculate its CV, then place it between plots A and B.