

On this page
When you observe sunlight through a high-resolution spectrometer, the continuous rainbow is crossed by thousands of sharp, dark gaps known as Fraunhofer lines. For decades after Joseph von Fraunhofer cataloged them, astronomers could not determine which chemical elements produced the vast majority of these missing frequencies. American astronomer Charlotte Moore Sitterly (1898–1990) systematically solved this puzzle, transforming scattered laboratory measurements into the data infrastructure of modern astrophysics, as recorded in William C. Martin's 1991 biographical memoir in Physics Today.
Who was Charlotte Moore Sitterly?
Born in Pennsylvania, Charlotte Emma Moore graduated from Swarthmore College in 1920 in mathematics and joined the Princeton University Observatory as an assistant to Henry Norris Russell. Because Princeton did not admit women to doctoral study, she completed her Ph.D. in astronomy at the University of California, Berkeley, in 1931, analyzing atomic lines in sunspot spectra, as noted in Martin's 1991 memoir. In 1945, she joined the National Bureau of Standards (NBS, now NIST), leading the spectroscopic data program until 1968.
How did she compile the atomic energy levels tables?
During the mid-twentieth century, laboratories worldwide measured atomic spectra from electric arcs and sparks, but published their results in conflicting notations and calibrations. Charlotte Moore Sitterly critically evaluated and recalculated these scattered records to establish unified tables of atomic structure.
Her defining work at NBS was *Atomic Energy Levels as Derived from the Analyses of Optical Spectra*, published as NBS Circular 467. The project spanned three volumes: Volume I in 1949 covering hydrogen through vanadium across 206 spectra, documented in NBS Circular 467 Volume 1; Volume II in 1952 covering chromium through niobium across 152 spectra; and Volume III in 1958 covering molybdenum through lanthanum and hafnium through actinium across 124 spectra (omitting the complex rare earths). Across these 482 spectra, she anchored ground states at 0.000 cm⁻¹, standardized term notations under Russell-Saunders LS-coupling rules, and evaluated ionization potentials in electron volts.
How did her tables identify chemical elements in the Sun?
Matching a solar line requires more than finding a single coincident wavelength. Moore Sitterly recognized that reliable identification demands matching an entire "multiplet"—the group of transitions sharing the same electron configuration and term symmetries. In 1945, she published the *Multiplet Table of Astrophysical Interest*, organizing laboratory transitions by multiplet number and intensity.
In 1966, together with Marcel Minnaert and Jakob Houtgast, she published The Solar Spectrum 2935 Å to 8770 Å as NBS Monograph 61. This compendium cataloged roughly 24,000 absorption lines with precise wavelengths and atomic term assignments. Her multiplet method identified 66 chemical elements in sunlight, reviewed in her survey Atoms and Ions in the Sun in Science. In 1951, she also reported candidate absorption lines of the unstable radioactive element technetium in sunlight, published in Science, sparking intense interest in stellar nucleosynthesis.
How do you calculate a solar absorption line from energy levels?
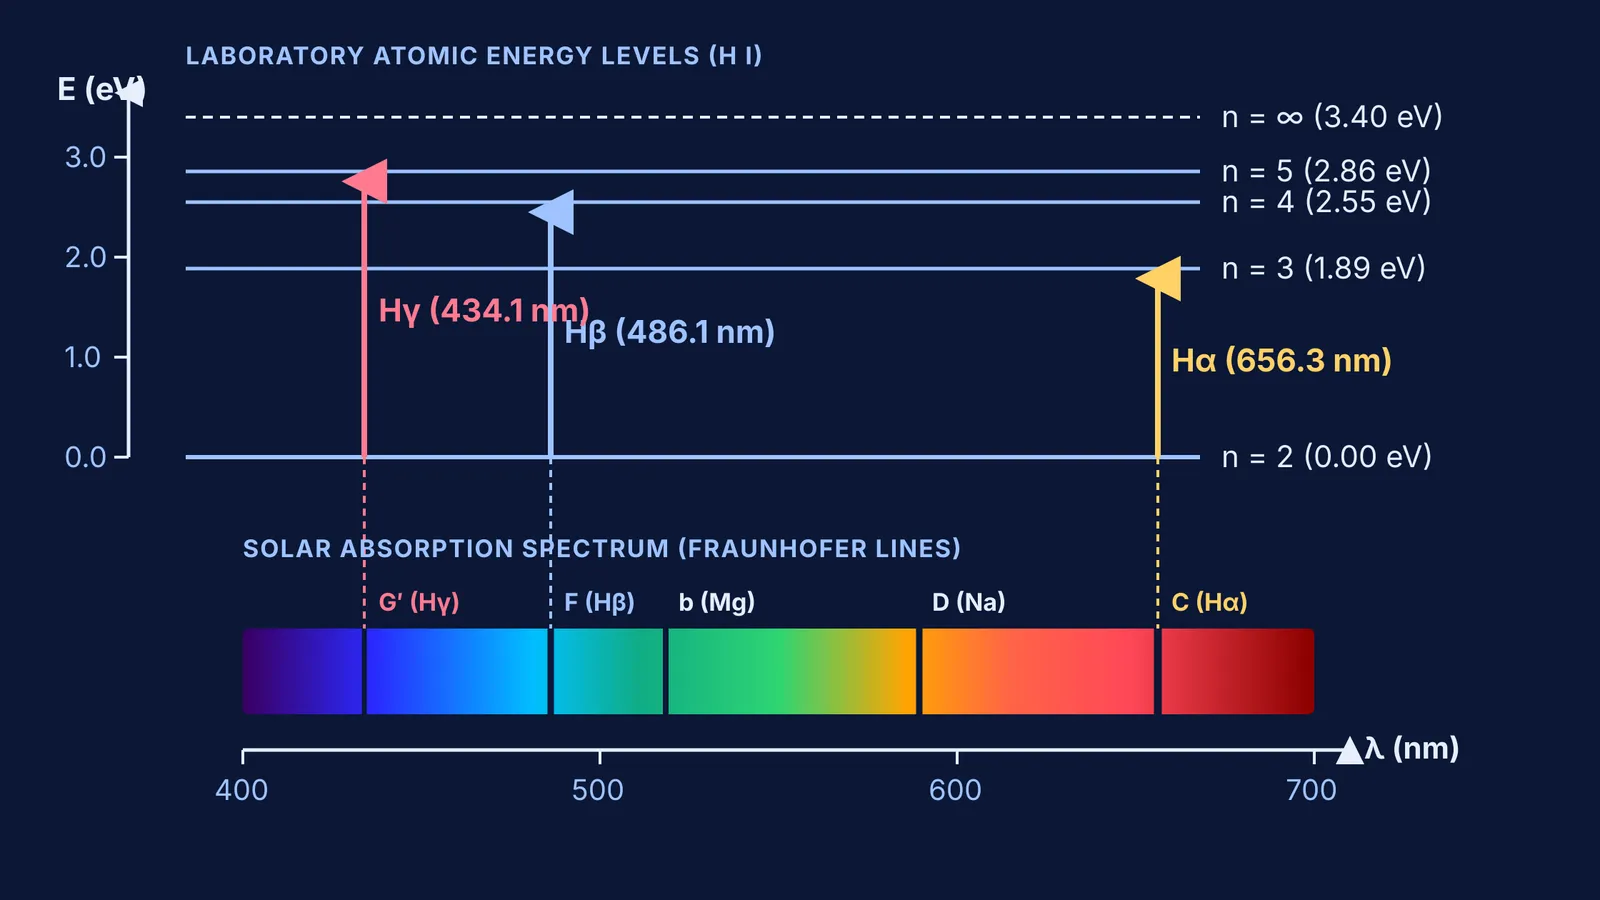
To see how Moore Sitterly connected laboratory energy levels to solar absorption lines, consider the Balmer-alpha line (Fraunhofer's C line) in hydrogen, using energy values tabulated in NBS Circular 467 Volume 1:
Identify term energies: The lower state (n = 2) has energy E₁ = 82,259.1 cm⁻¹ above the ground state, while the upper state (n = 3) has E₂ = 97,492.2 cm⁻¹.
Compute the wavenumber difference: The absorbed photon corresponds to ν̃ = E₂ − E₁ = 97,492.2 cm⁻¹ − 82,259.1 cm⁻¹ = 15,233.1 cm⁻¹.
Calculate vacuum wavelength: λ_vac = 1 / ν̃ = 1 / (15,233.1 cm⁻¹) = 656.46 nm.
Correct for air: With the refractive index of air (n_air ≈ 1.00028), the observed wavelength is λ_air = 656.46 nm / 1.00028 = 656.28 nm.
When solar spectrographs revealed an absorption line at 656.28 nm, her tables proved it was produced by neutral hydrogen absorbing light in the Sun's atmosphere.
What is the legacy of her spectroscopic data today?
Charlotte Moore Sitterly's compilations became the definitive reference standard in laboratories worldwide. Today, her evaluated data forms the core of the digital NIST Atomic Spectra Database. Astronomers analyzing stellar atmospheres and exoplanets continue to use these energy levels to decode incoming light.
How can students master atomic transitions and spectra?
Understanding how quantized energy levels create discrete spectral lines is essential for mastering atomic physics and spectroscopy. When tackling problems on atomic spectra:
Track the quantum states: Note the principal quantum number n and angular momentum quantum numbers.
Verify selection rules: Confirm allowed transitions, such as Δl = ±1 for electric dipole radiation.
Convert between units: Use ΔE = hc / λ to connect energy gaps in electron volts to wavelength in nanometres.
The Fermi Simulation Lab provides interactive simulations for ideas that are easier to see than to read, helping you observe how electron transitions absorb and emit photons. To study term symbols, electron configurations, and selection rules, explore the Fermi Concept Library, which covers every concept in physics and chemistry. For practice with spectral calculations and Rydberg formulas, the Fermi Problem Library offers worked problems with a step-by-step solver that explains the reasoning rather than printing an answer.


