On this page
In your biology textbook, climate, altitude and vegetation are linked: temperature falls as you climb, and plant communities change with it. One of the first people to draw that link as a single picture was Alexander von Humboldt. His 1807 diagram of a volcano in Ecuador, labelled with the plants found at each height, is one of the most famous images in the history of ecology. Modern scientists have gone back to check it. This post covers what Humboldt did, what the checks found, and why the second part may be the most useful lesson.
Who was Alexander von Humboldt?
The Alexander von Humboldt Foundation describes him as a nature researcher and explorer (1769-1859) whose Latin American journey from 1799 to 1804 "was celebrated as the second scientific discovery of South America". He travelled with the botanist Aimé Bonpland. A 2019 paper in PNAS by Pierre Moret and colleagues says the two spent five years exploring the forests and mountains of tropical America, taking physical measurements, recording natural history and collecting plants.
Humboldt's big idea was connection. In the first volume of Cosmos, his late account of the physical world, the 1849 English translation has him say that nature, seen as a whole, shows "unity in diversity, and of connection, resemblance and order, among created things most dissimilar in their form;—one fair harmonious whole."
What was the Tableau Physique?
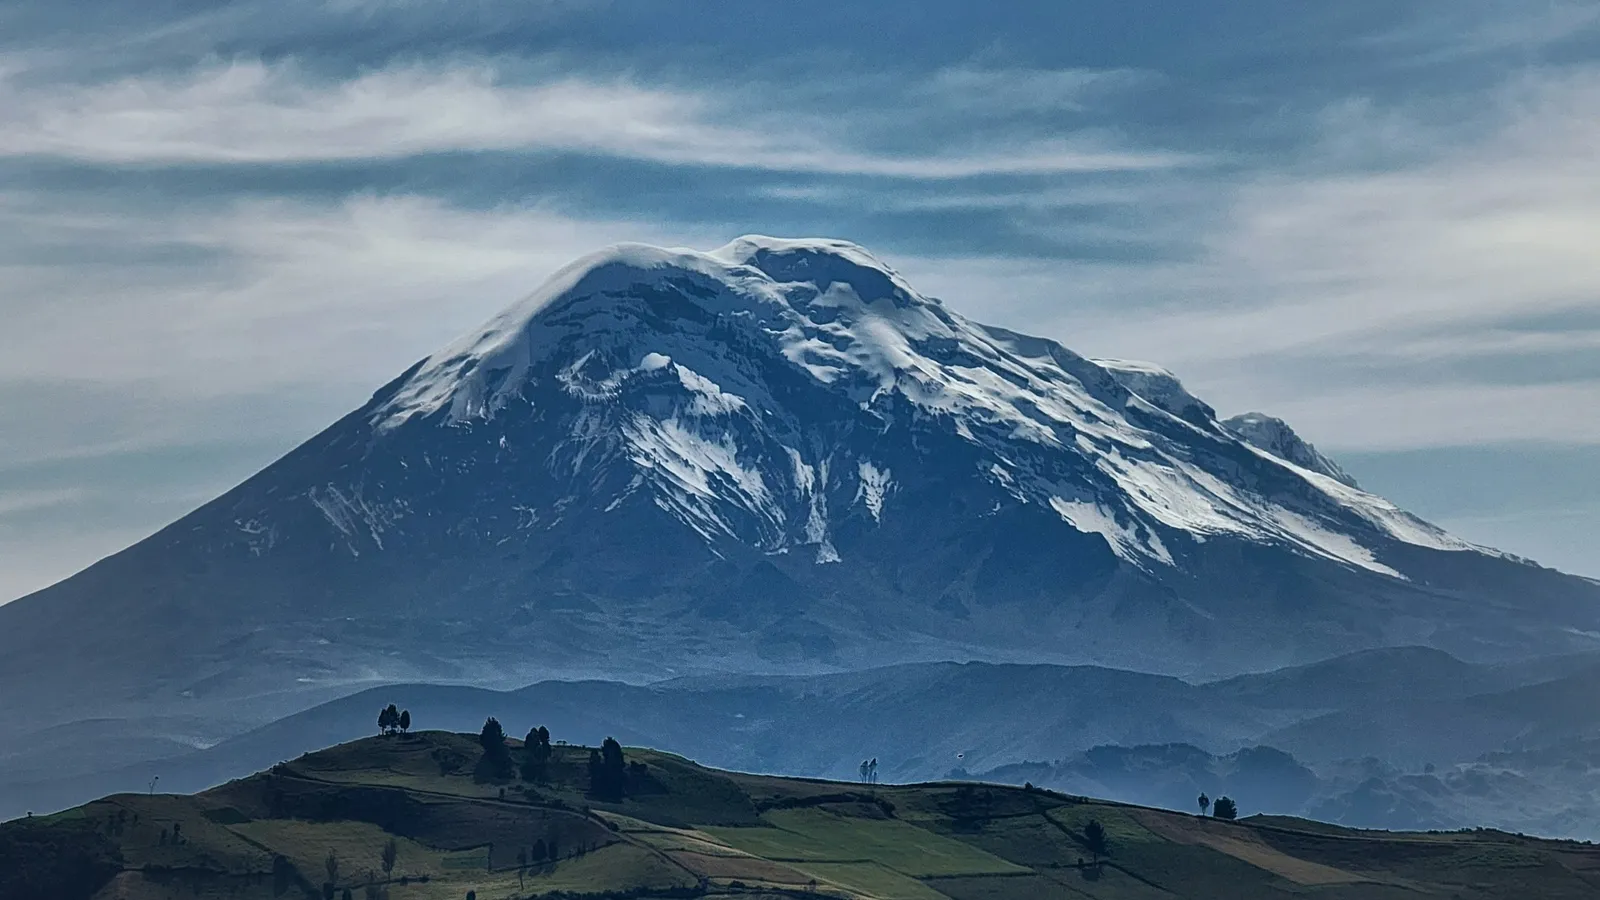
In 1802 Humboldt climbed the Chimborazo volcano in Ecuador and recorded plant species and vegetation zones along its slopes. In 1807 he and Bonpland published an Essay on the Geography of Plants, with a large diagram, the Tableau Physique: a cross-section of Chimborazo with plant names placed at the heights where they grew. Moret and colleagues write that this allowed Humboldt "to establish the concept of vegetation belt, thereby laying the foundations of biogeography". It also put forward the idea that climate is the main control on where plants grow on a mountain.
What did the 2015 resurvey find?
In June 2012, 210 years after Humboldt's climb, Naia Morueta-Holme and colleagues went back to Chimborazo. Their 2015 PNAS paper reported seed plants growing up to 5,185 m and upward shifts in the upper limits of plants of more than 500 m on average since 1802, consistent with warming and glacier retreat. It read as strong evidence that climate change is reshaping tropical mountains.
Then what did the 2019 study find?
Moret and colleagues went back further, to Bonpland's field journal, herbarium labels and Humboldt's later publications. Their conclusion was uncomfortable: the top part of the 1807 diagram, above the tree line, was "an intuitive construct based on unverified and therefore partly false field data". Nine plants shown as living above the tree line, at about 3,550 m, had actually been collected below 3,000 m. The diagram had changed little from a sketch drawn in 1803, before the plant collections had been studied.
Humboldt seems to have known something was off. The number and identity of the high-altitude plants he listed kept changing: 17 taxa above 3,900 m in 1807, 23 in 1817 and 32 in 1824, and they were not the same ones.
Most of the reliable high-altitude records, the authors found, came from a different mountain, Antisana, where Humboldt and Bonpland collected in March 1802. Resurveying Antisana gave an upward shift of 215 to 266 m over 215 years.
Put the two estimates side by side.
Antisana: 215 m ÷ 215 years = 1.0 m per year; 266 m ÷ 215 years ≈ 1.24 m per year. That is about 10 to 12 m per decade.
Chimborazo (2015): more than 500 m ÷ 210 years ≈ 2.4 m per year, or about 24 m per decade.
The 2019 estimate is about half the earlier one, and the authors note that it matches the 10 to 12 m per decade of upslope shift seen in studies worldwide. The warming signal is still there; its size depended on getting the old data right. The debate continued in print: PNAS published a letter in reply titled "Resurvey of Antisana supports overall conclusions of Chimborazo study".
What can a student take from Humboldt, and from his checkers?
Draw the whole system. The Tableau Physique put plants, temperature and height in one picture. Try summarising an ecology chapter as one labelled diagram.
Measure, then connect. His idea of connection rested on thousands of measurements. In practicals, record the numbers first and draw conclusions second.
Revise in public. Humboldt changed his plant lists in each later publication. Correcting your own notes is part of doing science, not a sign of failure.
Trace every number to its source. The 2019 study is a model of checking provenance. When you revise, ask where each figure in your notes came from.
Our guides to biodiversity and conservation and organisms and populations connect these ideas to your syllabus. If a concept such as a vegetation belt or a range shift is still fuzzy, the Fermi Concept Library covers every concept in physics, chemistry, biology, mathematics and computing, each with its own lesson.
Look up the 1807 Tableau Physique image this week and list three things it shows that your textbook explains in words.