

On this page
The variance of a discrete frequency distribution tells you how widely a set of data points is spread around its average, weighting each value by how often it occurs. When you are preparing for exams like JEE Main or CBSE Class 11, doing this calculation manually can be slow. Whether you are dealing with test scores, height measurements, or laboratory data, knowing how to process grouped numbers rapidly is a key skill. However, by adding fx and fx² columns to your table, you can skip the tedious subtraction of decimals. This makes the arithmetic significantly more straightforward and less prone to rounding errors.
According to standard statistical textbooks and resources like BYJU'S, the variance σ² is defined as the average of the squared differences from the mean. While the definition formula requires you to find the deviation of every single row, the computational shortcut formula relies purely on sums, bypassing the need to carry decimals through every step.
What is the formula for the variance of a discrete frequency distribution?
For a set of data where values x appear with frequencies f, the standard definition is:
Variance = Σf(x - x̄)² / N
Here, N = Σf is the total frequency, and x̄ is the mean.
But this requires calculating x - x̄ for every row, which gets messy if the mean is a decimal. Instead, the algebraic expansion gives us a shortcut. The variance of a discrete frequency distribution is:
Variance = [Σfx² / N] - [Σfx / N]²
In simple terms: it is the mean of the squares minus the square of the mean. Once you have the variance, the standard deviation is just its positive square root (σ = √Variance).
How do you set up the frequency table?
To use the shortcut formula without mistakes, you need exactly four columns:
x: The observation values.
f: The frequency of each observation.
fx: The product of f and x (used to find the mean).
fx²: The product of f and x². Warning: Multiply the fx column by x again, rather than squaring the fx column.
Add up the f, fx, and fx² columns to get your totals.
If you struggle to remember which column goes where when solving problems under time pressure, the Fermi Concept Library has a lesson for every mathematical concept and its place in the map.
Example: Calculating variance and standard deviation
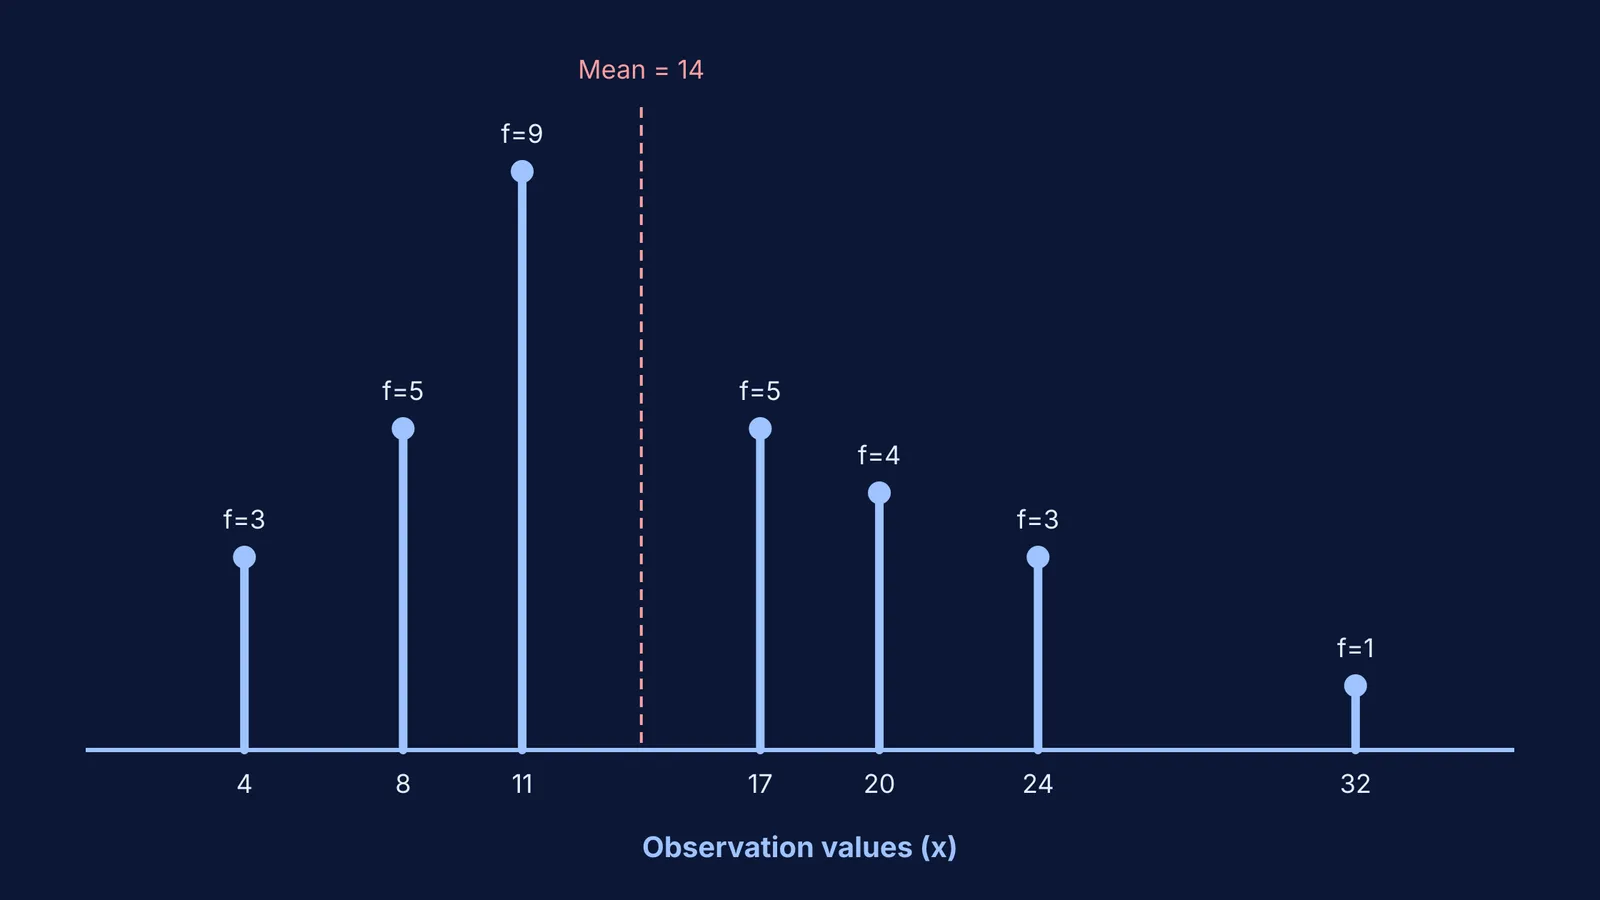
Let us find the variance and standard deviation for this discrete frequency distribution dataset.
The data: x: 4, 8, 11, 17, 20, 24, 32 f: 3, 5, 9, 5, 4, 3, 1
Step 1: Fill the table
For x = 4 and f = 3: fx = 12, and fx² = 4 × 12 = 48.
For x = 8 and f = 5: fx = 40, and fx² = 8 × 40 = 320.
For x = 11 and f = 9: fx = 99, and fx² = 11 × 99 = 1089.
For x = 17 and f = 5: fx = 85, and fx² = 17 × 85 = 1445.
For x = 20 and f = 4: fx = 80, and fx² = 20 × 80 = 1600.
For x = 24 and f = 3: fx = 72, and fx² = 24 × 72 = 1728.
For x = 32 and f = 1: fx = 32, and fx² = 32 × 32 = 1024.
Step 2: Find the sums
Total N = Σf = 30
Sum of fx = 420
Sum of fx² = 7254
Step 3: Apply the shortcut formula Mean (x̄) = 420 / 30 = 14. Mean of squares = 7254 / 30 = 241.8.
Variance = 241.8 - (14)² = 241.8 - 196 = 45.8.
The standard deviation is √45.8 ≈ 6.77.
Why use the shortcut over the standard formula?
When dealing with real exam questions, means are rarely clean integers. If the mean of the above dataset had been 14.1, finding (x - 14.1)² for seven rows would introduce heavy decimal multiplication. The shortcut method keeps you working with whole numbers until the very final step of dividing by N.
If you want to test this logic on harder data, Fermi's AI tutor sits alongside you in the Fermi Problem Library. If you forget to multiply fx by x and make a mistake in your table, the tutor notices where you are stuck and decides whether to explain, ask, or show, writing out the correct step on a board rather than printing an answer.
This same logic underpins more advanced adjustments. If you multiply every value by a constant, you will need to understand how adding to or scaling data changes the mean and variance. This comes up frequently when data is coded or transformed to make it easier to handle. When merging two sets of grouped data from different samples, the logic expands into the combined variance formula. On the other hand, if you want to ignore squaring entirely to reduce the effect of large outliers, you might use the mean absolute deviation about the median. By mastering the standard shortcut first, you will find that these advanced techniques rely on the exact same principles. Keep your columns neat, remember to track your totals carefully, and the variance will drop out easily every time.


