

On this page
Understanding the graph of tan x is essential for trigonometry in Class 11 and entrance exams like JEE. Unlike the smooth, continuous waves of sine and cosine, the tangent function breaks into separate branches, divided by invisible lines called vertical asymptotes.
But why does the tangent graph look this way? The secret lies in its definition as the ratio of sine to cosine.
What is the graph of tan x?
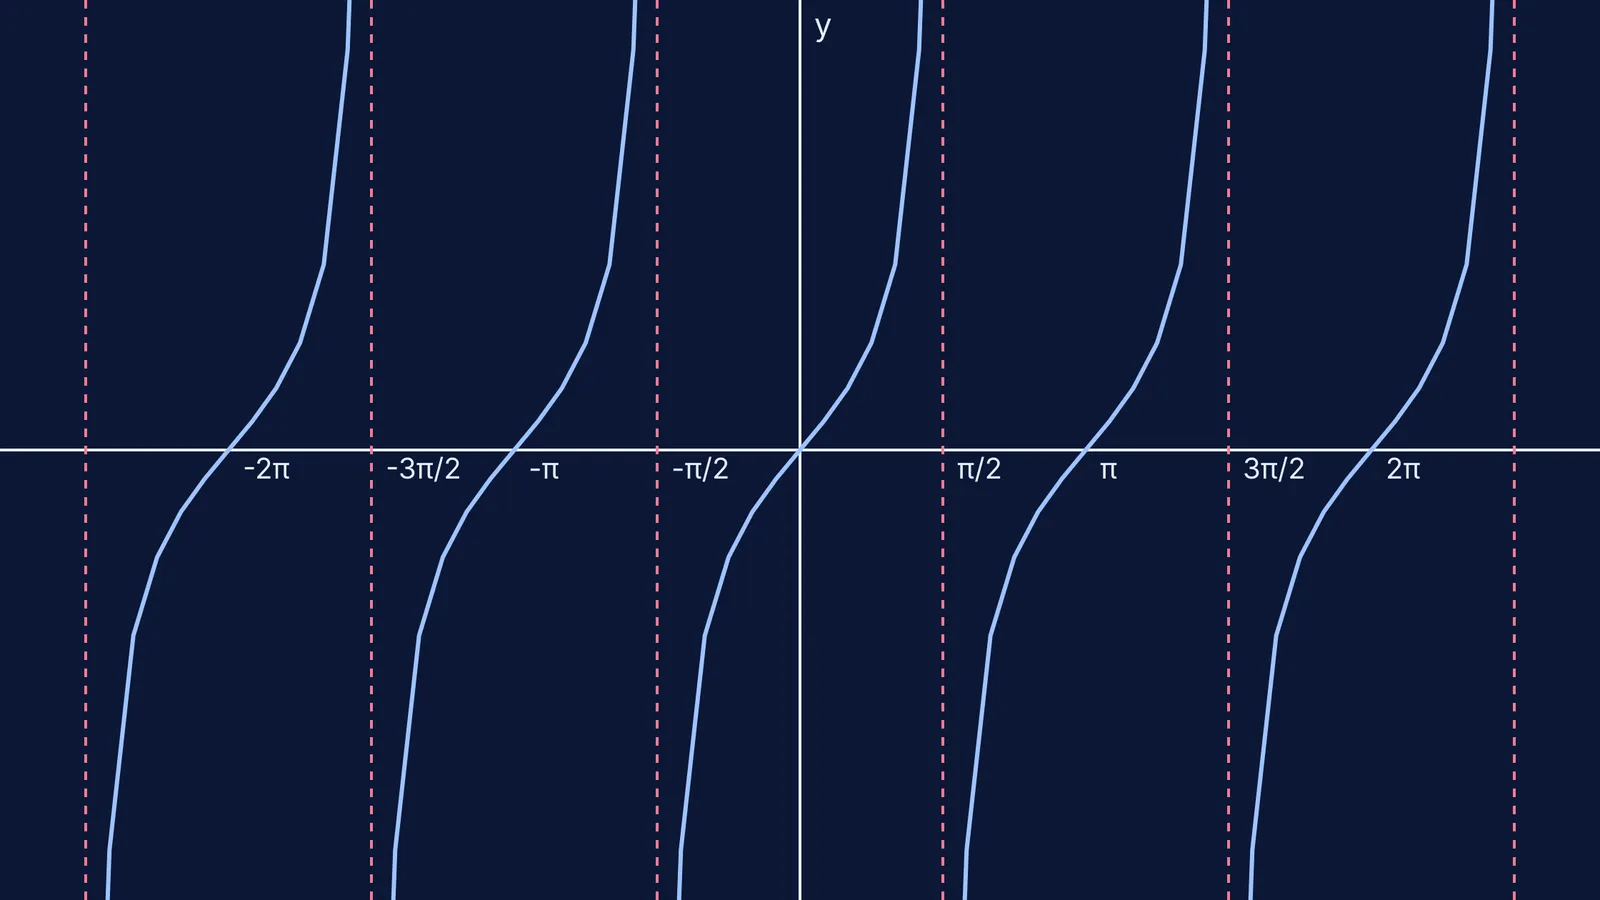
The graph of y = tan x consists of repeating, S-shaped curves. As x increases from 0 to π/2, the tangent value shoots up towards positive infinity. As x goes from 0 down to −π/2, the value plunges to negative infinity.
According to OpenStax mathematics resources, the period of the tangent function is π. This is a major difference from sine and cosine, which have a period of 2π. A single, complete cycle of the tangent function fits entirely between −π/2 and π/2. The function then perfectly repeats this identical curve infinitely in both directions along the x-axis. Recognising that this basic building block is narrower than the other trigonometric waves is a useful trick when finding periods for JEE math problems.
The key features of the y = tan x graph are:
Domain: All real numbers except odd multiples of π/2.
Range: All real numbers (from −∞ to ∞), which is entirely different from the restricted bounds you see in maximum and minimum value problems involving sine and cosine.
x-intercepts: Occur at integer multiples of π (such as 0, π, 2π).
y-intercept: Crosses the origin at (0, 0).
Where are the asymptotes of tan x?
If you try to calculate tan(π/2) on a calculator, you will get an error. This is because the tangent function has vertical asymptotes at these points.
A vertical asymptote is a vertical line that the graph gets infinitely close to, but never actually touches or crosses. For the basic tangent graph, these asymptotes are found at odd multiples of π/2:
x = …, −3π/2, −π/2, π/2, 3π/2, …
In general mathematical notation, the asymptotes occur at x = π/2 + kπ, where k is any integer. The graph is entirely undefined at these values, meaning there is absolutely no y-value for these specific x-coordinates. You can never point to a coordinate on the line x = π/2 and say "the graph passes through here".
How does tan x follow from sin x and cos x?
To understand the shape and the asymptotes of the tangent graph, look at its fundamental identity:
tan x = sin x / cos x
This single equation explains both the period and the breaks in the graph:
The zero points: When the numerator (sin x) is 0, the whole fraction is 0. Since sin x = 0 at 0, π, 2π, these are the x-intercepts of the tangent graph.
The asymptotes: Division by zero is undefined. Whenever the denominator (cos x) is 0, the tangent function hits an asymptote. Since cos x = 0 at π/2, 3π/2, −π/2, those are the exact locations of the vertical asymptotes.
If you struggle to remember these relationships during a test, drawing the unit circle is the fastest way to reconstruct the graph. If you want to learn more about how trigonometric functions connect, the Fermi Concept Library has a lesson for every concept in mathematics and its place in the map.
How to sketch the tangent graph step by step?
If you need to draw y = tan x in an exam, use this checklist to get it right:
Draw the axes: Set up your x-axis marked clearly in intervals of π/2. A standard scale goes from −2π up to 2π, plotting points at −π, −π/2, 0, π/2, and π.
Mark the asymptotes: Draw faint or dashed vertical lines at every odd multiple of π/2. These are the rigid boundaries that your curves must approach but never cross.
Plot the intercepts: Place a solid dot at the origin (0, 0). Add dots at every integer multiple of π (such as π, 2π, −π, −2π). These are the anchor points for the center of each curve.
Draw the curves: Starting from an intercept (like 0), draw a smooth, sweeping curve that bends upwards to hug the right asymptote (towards +∞). Then, draw it bending downwards to hug the left asymptote (towards −∞). Ensure the curve passes smoothly through the x-axis.
Check transformations: If you are sketching a modified function like y = tan(2x) or y = 3 tan x, remember that the period or steepness changes. For y = tan(2x), setting 2x = π/2 tells you the new first asymptote is at x = π/4, effectively squashing the graph horizontally.
Working through shifted and scaled tangent graphs can be tricky, especially since finding the inverse tangent means reflecting the graph restricted strictly between its two central asymptotes. If you get stuck on a homework question involving transformations, the Fermi Problem Library has worked problems with a step-by-step solver that explains the reasoning rather than printing an answer.


