

On this page
When a toy car, a frictionless bead, or a roller coaster descends from a hilltop of height h along a frictionless track, does the shape of the track affect its speed at the bottom? The short answer is no. Whether the ramp is a steep drop, a gentle slope, a circular quarter-pipe, or a wavy roller coaster, the speed at the bottom is always v = √(2gh).
Yet if you release two identical marbles simultaneously down a straight ramp and a curved bowl of identical height and span, the marble on the curved track reaches the bottom first. This contrast between final speed and elapsed time is one of the classic paradoxes of introductory mechanics, separating energy principles from kinematics.
Does track shape change the speed at the bottom?
In classical mechanics, the speed of an object sliding down a smooth surface is determined entirely by the work-energy theorem. As detailed in OpenStax University Physics on conservative forces, two forces act on the object during its slide: gravity pointing vertically downward, and the normal contact force pointing perpendicular to the track at each point.
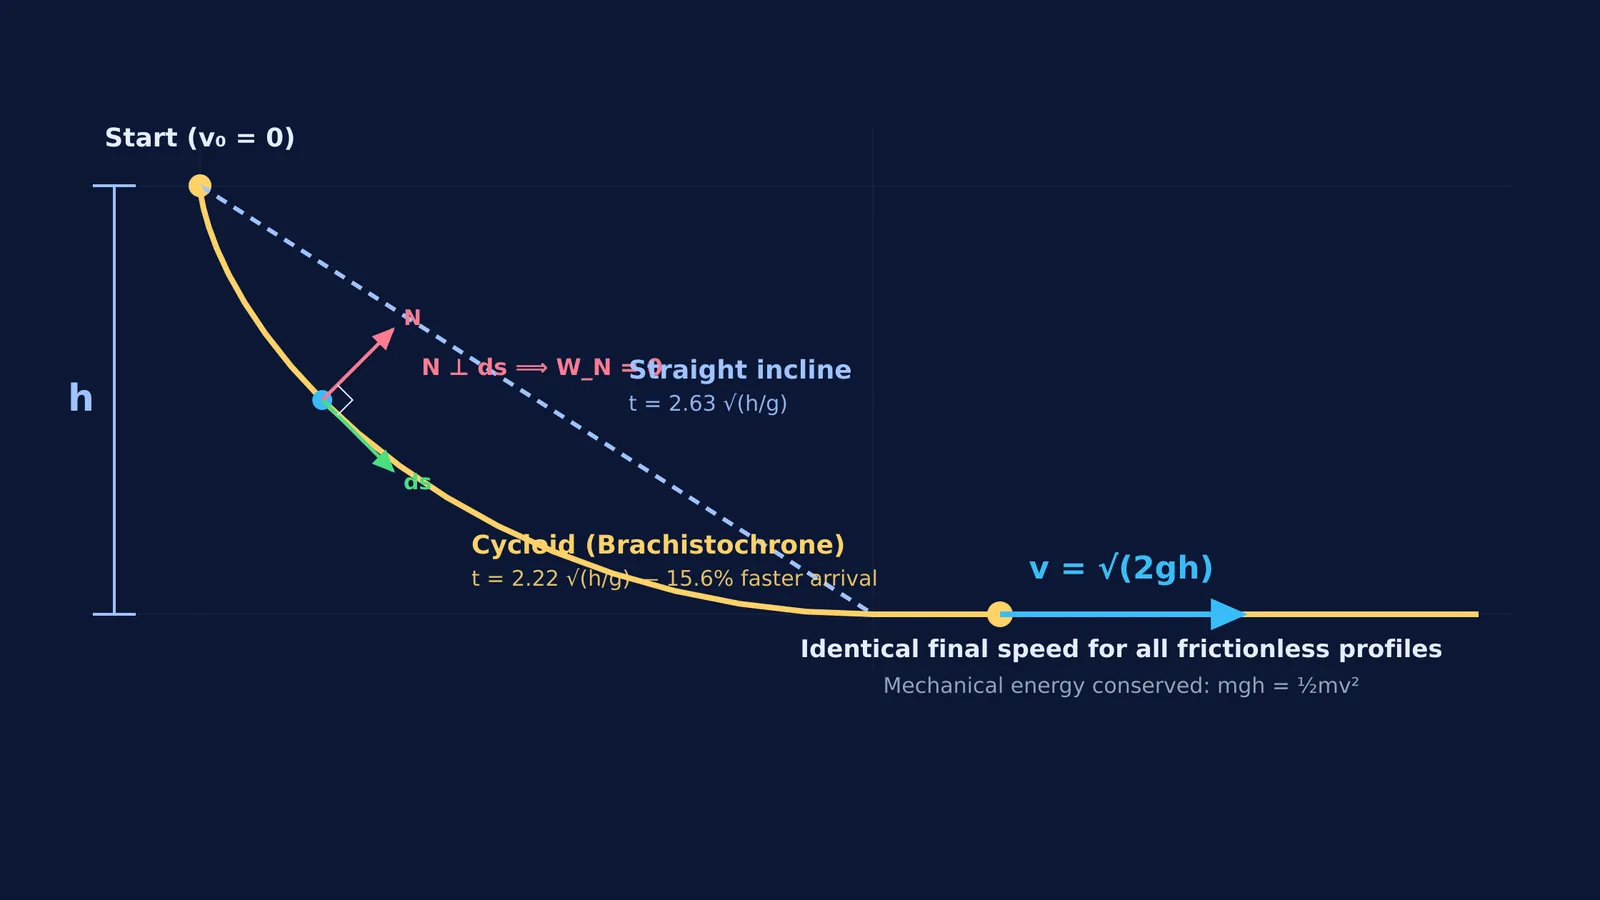
Because the track is rigid and smooth, the displacement vector ds is always tangent to the surface, making the normal contact force N perpendicular to ds at every instant. Consequently, the dot product vanishes and the normal force does zero work across the entire descent:
W_N = ∫ N · ds = 0
Gravity, meanwhile, is a conservative force. Its work depends solely on the vertical drop between initial and final coordinates, completely independent of the horizontal path taken:
W_g = -ΔU = mg(y_initial - y_final) = mgh
By the work-energy theorem, the total work done equals the change in kinetic energy: W_net = W_g + W_N = mgh. For an object starting from rest (v₀ = 0), this simplifies directly:
(1/2)mv² = mgh
v = √(2gh)
The mass m cancels out, and no variable representing track curvature, slope angle, or path length enters the equation. Applying the work-energy theorem in mechanics reveals that final speed is a state function of vertical drop alone.
Why do students assume a steeper ramp reaches higher speed?
Despite the simplicity of conservation of energy, physics educators have long documented that students intuitively believe steeper tracks yield greater final speeds. In a landmark study published in the *American Journal of Physics*, researchers David E. Trowbridge and Lillian C. McDermott (1980) found that students frequently evaluate velocity using a "position criterion"—judging an object to be faster simply because it is ahead in space or accelerated earlier.
This confusion deepens on curved ramps. In *The Physics Teacher*, John A. Milsom (2021) demonstrated that introductory and advanced students alike struggle to decouple instantaneous acceleration from total energy change. A steep drop gives a high early acceleration, creating the visual impression of a faster track.
Untangling path-dependent quantities from state variables is essential in mechanics problems. The Fermi Problem Library provides worked problems with a step-by-step solver that explains the reasoning rather than printing an answer, helping students identify why energy conservation bypasses complex trajectory equations.
If final speeds match, why do arrival times differ?
While final speed depends solely on total height drop, travel time depends on the entire velocity profile v(s) along the path:
t = ∫ ds / v(s)
Even though both tracks end at identical final speeds v = √(2gh), the shape determines where along the journey that speed is acquired:
On a straight incline, acceleration is constant (a = g sin θ). Speed builds gradually from zero, so the average speed over the descent is only half the final speed: v_avg = (1/2)√(2gh).
On a steeply curved ramp, the object drops rapidly near the start, converting gravitational potential energy into kinetic energy early. It covers the remainder of the horizontal distance at near-maximum speed.
On a ramp that starts flat and drops steeply only at the end, the object creeps along at low speeds for most of the run, resulting in the slowest transit time.
How does the brachistochrone minimise transit time?
The search for the curve that produces the absolute minimum travel time is known as the brachistochrone problem (from the Greek *brachistos*, shortest, and *chronos*, time). In June 1696, Swiss mathematician Johann Bernoulli published this challenge in the journal *Acta Eruditorum*, inviting mathematicians to discover the curve connecting two points along which a body descends in the shortest time under gravity.
Earlier, as explored in Galileo's inclined plane experiments, Galileo Galilei correctly recognized that a circular arc is faster than a straight ramp, though he did not find the true minimum. Bernoulli, alongside Isaac Newton, Gottfried Leibniz, and Jakob Bernoulli, proved that the optimal curve is a cycloid—the path traced by a point on the rim of a rolling wheel.
What does a worked comparison reveal?
Consider a frictionless track with vertical drop h and horizontal run L = π h / 2:
Straight ramp:
Path length s = √(L² + h²) ≈ 1.86 h and constant acceleration a = gh / s yield a descent time of t_straight = √(2s / a) = √((π² + 4)/2) √(h/g) ≈ 2.633 √(h/g).
Cycloid track:
For a rolling circle of radius R = h / 2, the travel time from cusp to lowest point is t_cycloid = π √(R/g) = (π / √2) √(h/g) ≈ 2.221 √(h/g).
The cycloid delivers the object 15.6% faster than the straight ramp, yet both arrive with the exact same speed v = √(2gh). In the *European Journal of Physics*, physicists Carl E. Mungan and Trevor C. Lipscombe (2017) analyzed segmented ramps and found that just three joined straight ramps come within 5% of this optimal cycloidal time, mirroring how real-world roller coasters and slides are engineered. For further practice analyzing motion along slopes, explore calculating descent times on inclines.
Understanding how curvature alters acceleration while preserving final mechanical energy is central to mechanics. The Fermi Simulation Lab offers interactive simulations for the ideas that are easier to see than to read, letting you test how varying ramp profiles affects transit times in real time.


