

On this page
When the prices of everyday goods rise over time, economists use an index number to measure the change. A price index compares the cost of a "basket" of goods in a current year against a starting point, known as the base year.
If you are studying for economics or mathematics exams, you will find this topic detailed in the NCERT Class 11 Statistics for Economics textbook. Let us look at how the simplest method works.
What is a simple aggregative price index?
The simple aggregative price index is the most basic way to measure relative changes in the price level of a group of commodities over time. In this unweighted method, we treat all items in the basket as equally important, whether they are a kilogram of rice or a litre of milk.
To find it, you add up the prices of all the items in the current year, and express that total as a percentage of the total price of the exact same items in the base year. You can read the original definition and its limitations in the NCERT chapter on index numbers.
How to calculate price index number?
To calculate the simple aggregative price index, you need the prices from two distinct periods. The formula is:
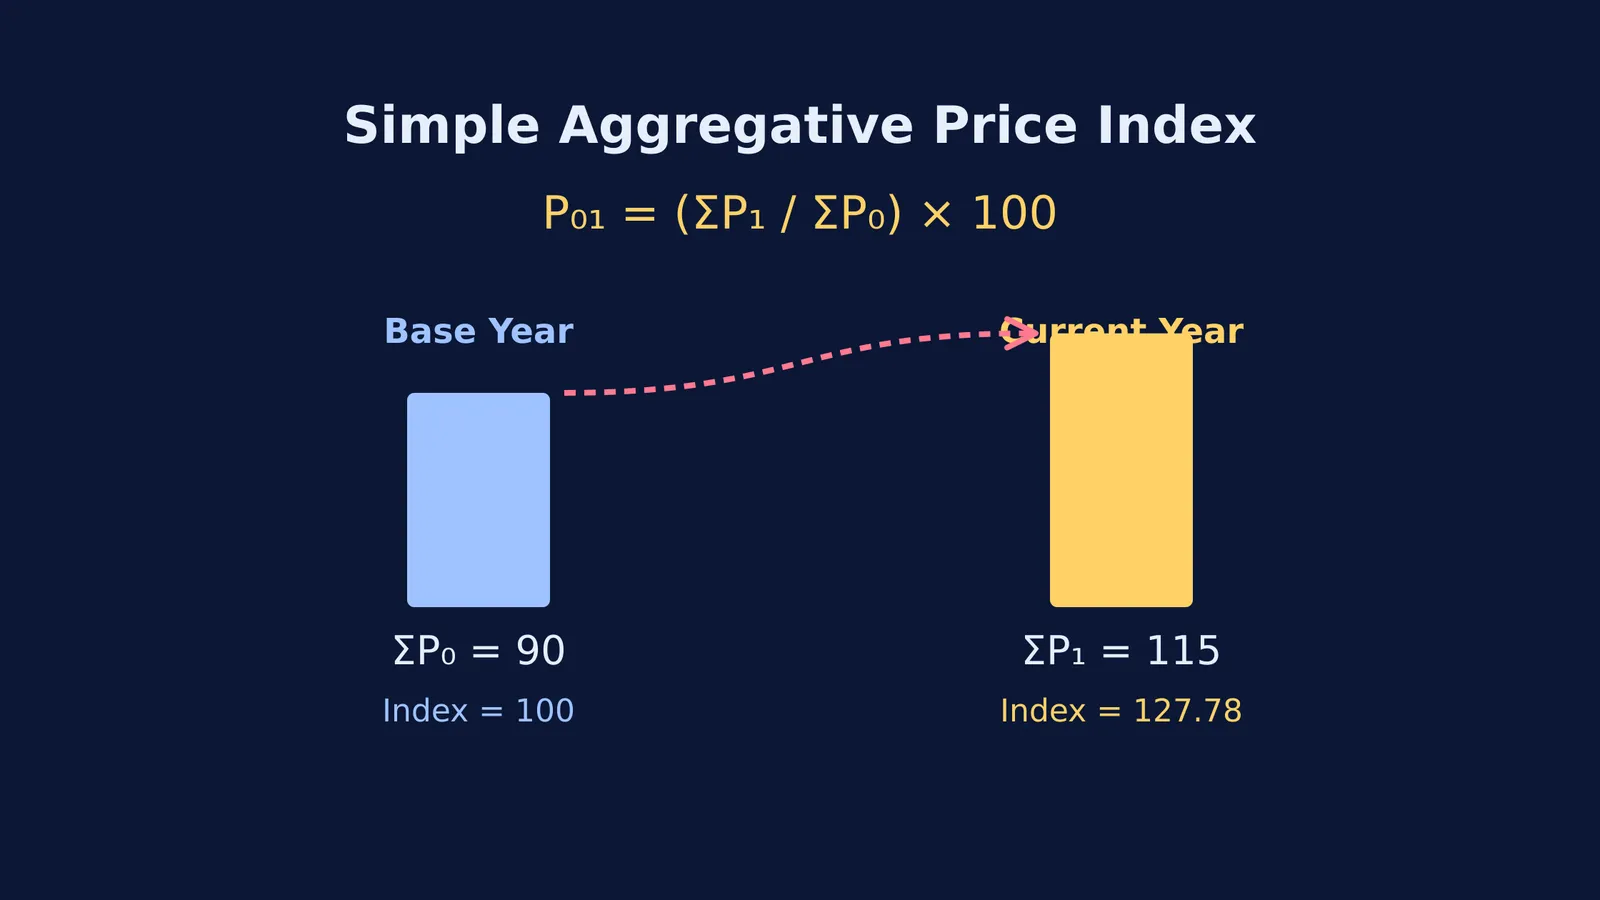
P₀₁ = (ΣP₁ / ΣP₀) × 100
Here is what the symbols stand for in the formula:
P₀₁ is the price index of the current year (denoted by 1) with respect to the base year (denoted by 0).
ΣP₁ is the sum (Σ) of the prices of all commodities in the current year.
ΣP₀ is the sum (Σ) of the prices of the same commodities in the base year.
The base year acts as your starting point for comparison. It should ideally be a normal year, free from extreme economic events like severe droughts, wars, or hyperinflation. If you pick a base year where prices were artificially high because of a crisis, your index for normal years will look artificially low, destroying the fairness of the comparison.
Why does the choice of base year matter?
The base year is the foundation of your index calculation. If we measure today's prices against a base year that was fifty years ago, the basket of goods itself will likely be entirely irrelevant. For example, a consumer basket in the 1970s would not include mobile phones or internet data plans.
This is why economists regularly update the base year, ensuring it remains a recent year that accurately reflects what people are currently buying. It keeps the index numbers meaningful.
What does an index of 125 mean?
By convention, the base year index is always set to exactly 100. This makes it incredibly easy to read the percentage change directly from the new index number.
If you calculate the price index for the current year and the result is 125, you compare it directly to 100. Subtracting the base year index (125 − 100) gives 25. This means that, on average, the prices of the commodities in your basket have risen by 25% since the base year.
Similarly, if the index number drops below 100, it indicates deflation in that basket. An index of 90 would mean prices have fallen by 10%. To explore more foundational ideas in statistics and economics, the Fermi Concept Library maps out every topic you will encounter in your syllabus.
A worked example: calculating the index
Let us say you want to calculate the price index for the year 2024, using 2020 as the base year. Your basket has three essential items: wheat, rice, and sugar.
List the base year prices (P₀) for 2020:
Wheat: ₹20 per kg
Rice: ₹40 per kg
Sugar: ₹30 per kg
The sum of base year prices (ΣP₀) = 20 + 40 + 30 = ₹90.
List the current year prices (P₁) for 2024:
Wheat: ₹25 per kg
Rice: ₹50 per kg
Sugar: ₹40 per kg
The sum of current year prices (ΣP₁) = 25 + 50 + 40 = ₹115.
Apply the simple aggregative formula:
P₀₁ = (115 / 90) × 100 P₀₁ = 1.2778 × 100 P₀₁ = 127.78
The price index for 2024 is 127.78. Because the base year is 100, this indicates an overall price increase of 27.78% since 2020 across this specific basket of goods.
If you are practising these sums, the Fermi Problem Library has worked problems with a step-by-step solver that explains the reasoning rather than printing an answer. If you also need a recap of earlier topics, you can review how to find the mean, median and mode of grouped data, or step up to worked problems for mean, variance and standard deviation.


