

On this page
When solving probability problems for school or entrance exams, you are often given partial data about two events. The most reliable way to organise this data and avoid mistakes is to draw a 2 × 2 probability table (also known as a contingency table).
Why do students struggle with conditional probability?
A contingency table makes the numbers visible, but it does not stop every mistake. According to a 2007 study by Carmen Díaz and Inmaculada de la Fuente published in the International Electronic Journal of Mathematics Education, when students were asked to read probabilities from a two-way contingency table, 90% could find a simple probability, but only 59% correctly calculated a conditional probability.
The researchers found two common traps in how students process these numbers. First, 31% of students confused a joint probability—the intersection P(M ∩ P)—with a conditional probability. They stopped calculating too early, forgetting to divide by the row or column total.
Second, 59% of students committed the fallacy of the transposed conditional, treating P(M | P) as if it were the exact same thing as P(P | M). In a medical context, this is like confusing the probability of testing positive if you are sick with the probability of being sick if you test positive—two completely different numbers. This error is deeply tied to how students confuse independent vs mutually exclusive events.
What is a 2 × 2 probability table?
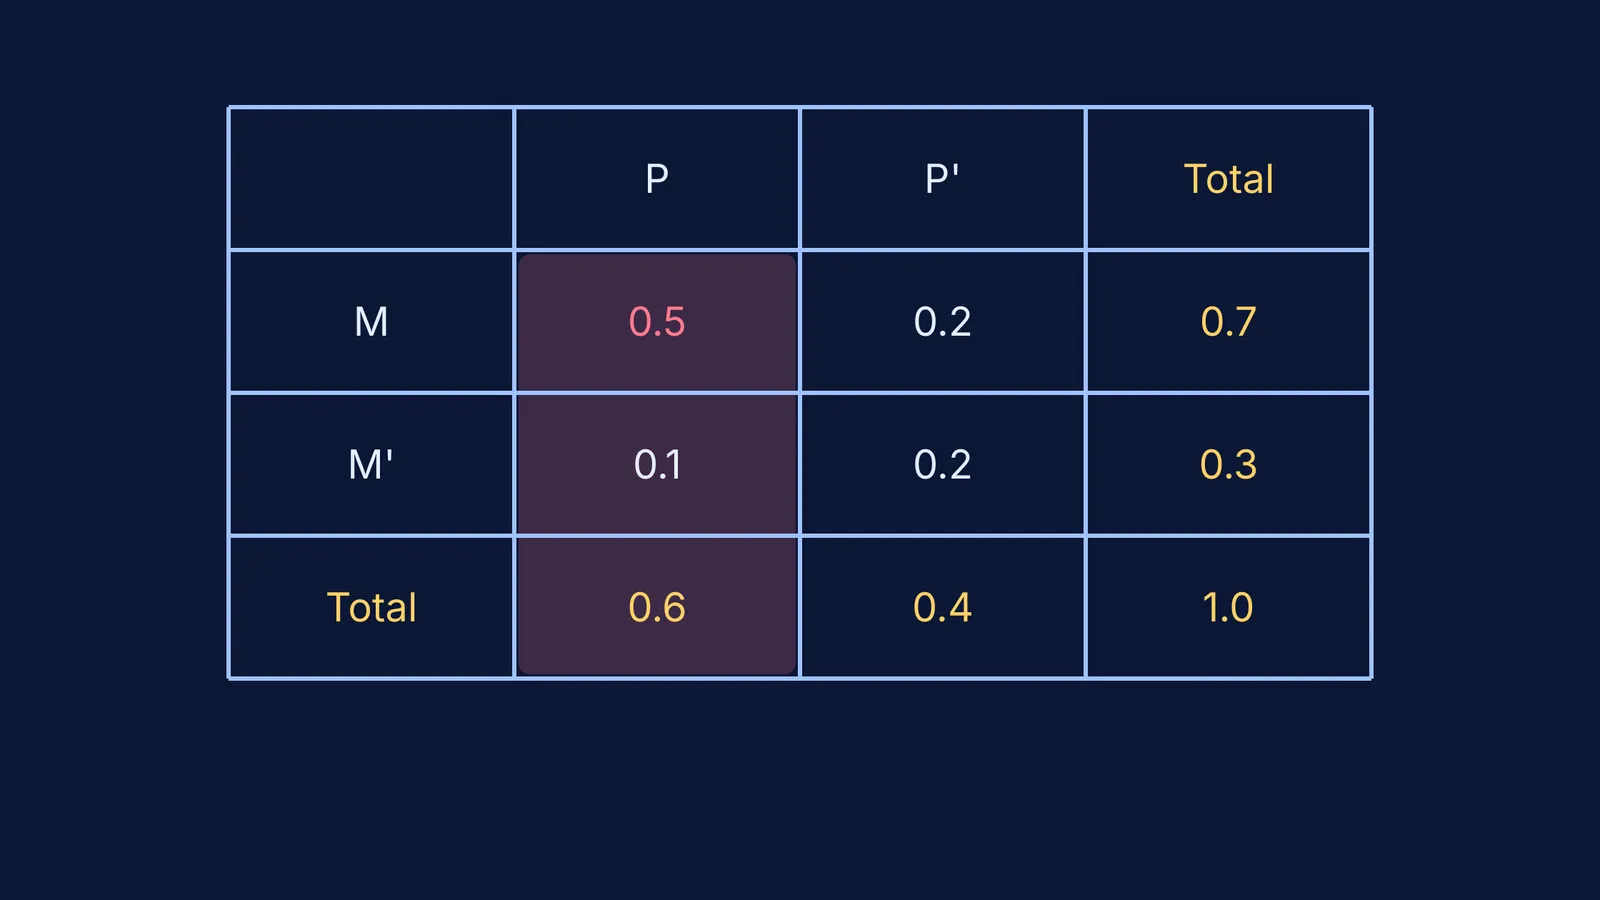
A probability table organizes two events (let us call them M for passing Maths, and P for passing Physics) and their complements (M' and P') into a clear grid of rows and columns. This format is useful for exams, as it forces you to account for every possible outcome in the sample space without drawing messy Venn diagrams.
The inner cells represent the intersections (joint probabilities). These are the specific cases where two things happen at once, such as P(M ∩ P) for passing both, or P(M' ∩ P) for failing Maths but passing Physics.
The margins (edges) represent the totals for each row and column. These give you the simple probabilities, like the overall P(M) or P(P), regardless of the other subject.
The bottom-right corner is the grand total of all probabilities, which must always equal 1.0 (or 100%).
How to complete the probability table for two events?
If an exam question gives you partial data, you can logically deduce the rest using the rule that every row and column must add up exactly to its total margin. Here is the four-step method to fill in the blanks:
Draw the grid: Make a table with columns for P, P' and Total, and rows for M, M' and Total. Write 1.0 in the bottom-right Total cell.
Place the given values: Put the simple probabilities in the margins and any joint probabilities (intersections) in the inner cells.
Subtract to fill gaps: If you know the total for M is 0.7 and the intersection P(M ∩ P) is 0.5, then the remaining part, P(M ∩ P'), must be 0.7 − 0.5 = 0.2. Repeat for every row and column.
Check your work: Ensure every horizontal row and vertical column adds up exactly to its margin. If they do not, you have placed a number in the wrong cell.
If you have concept gaps when setting up these tables from word problems, the Fermi Concept Library has every concept in mathematics and physics, each with its own lesson and its place in the map.
How do you read conditional probabilities from the table?
Once your table is complete, answering any exam question becomes straightforward, provided you look at the correct denominator.
To find an intersection (AND): Read the inner cell where the row and column cross. For example, P(M ∩ P) is simply the value located in the M row and P column.
To find a union (OR): Use the standard addition rule formula: P(M ∪ P) = P(M) + P(P) − P(M ∩ P). You can pull all three of these required numbers directly from your completed table.
To find a conditional probability: This is where 41% of students make their mistake. For P(M | P) (the probability of passing Maths given that you passed Physics), you must restrict your sample space. Ignore the grand total of 1.0. Look only at the P column. The denominator is the P total, and the numerator is the M cell within that specific column.
For example, if the P column has an intersection of 0.5 and a total of 0.6, then your conditional probability is P(M | P) = 0.5 / 0.6 = 5/6. You are essentially asking: out of the 0.6 space where Physics was passed, what fraction also passed Maths?
When you are practising these methods at home and cannot find where your logic went wrong, the Fermi Problem Library has worked problems with a step-by-step solver that explains the reasoning rather than printing an answer.
Mastering contingency tables early in your studies will give you a clear advantage when you encounter complex word problems, allowing you to transition smoothly into conditional probability and Bayes' theorem in Class 12.


