

On this page
In physics, power is the rate at which work is done or energy is transferred. While the formula P = W/t works for constant power, real-world machines—like a car engine accelerating or an electric motor spinning up—do not deliver power at a constant rate.
When power changes over time, calculating the total energy requires looking at the area under the power-time graph.
Why is the area under a power-time graph equal to energy transferred?
Power is defined mathematically) as the derivative of work with respect to time (P = dW/dt). To find the total work done (which equals the energy transferred), you must integrate the power over the time interval.
In calculus, a definite integral represents the area under a curve. Therefore, on a graph where the y-axis is power (in watts or J/s) and the x-axis is time (in seconds), the area bounded by the curve and the time axis is exactly the energy transferred (in joules).
How do you calculate energy from a stepped power graph?
A stepped graph represents a system where power changes instantly between different constant levels. For instance, a hypothetical electric heater might run at 1000 W for 5 seconds, drop to 500 W for 10 seconds, and then turn off.
To find the total energy, break the graph into a series of rectangles. The area of each rectangle is its base multiplied by its height:
Area of a rectangle = base × height = Δt × P
Calculate the area of each individual step and add them together. If a machine runs at 100 W for 4 seconds, the area is 400 J. If it then runs at 50 W for 2 seconds, the area is 100 J. The total energy transferred is 500 J. If you are working on thermodynamics graphs, the logic is similar to finding the net work in a cycle by reading the loop on an indicator diagram.
How do you find the energy from a triangular power curve?
When a machine speeds up uniformly from rest, its power output might increase linearly, creating a straight diagonal line on the graph. This shapes the area under the curve as a triangle (or a trapezium if it starts from a non-zero power).
You do not need to integrate a linear function of t to find the answer. You can use standard geometry:
Area of a triangle = ½ × base × height = ½ × Δt × P_max
If a motor's power output rises steadily from 0 to 100 W over 4 seconds, the energy transferred is ½ × 4 s × 100 W = 200 J. If the graph is a more complex trapezium, split it into a rectangle and a triangle, calculate both areas, and sum them. This is the same geometrical trick you might use when finding the area of a triangle using determinants, though applied to physics.
How do you solve a worked example for competitive exams?
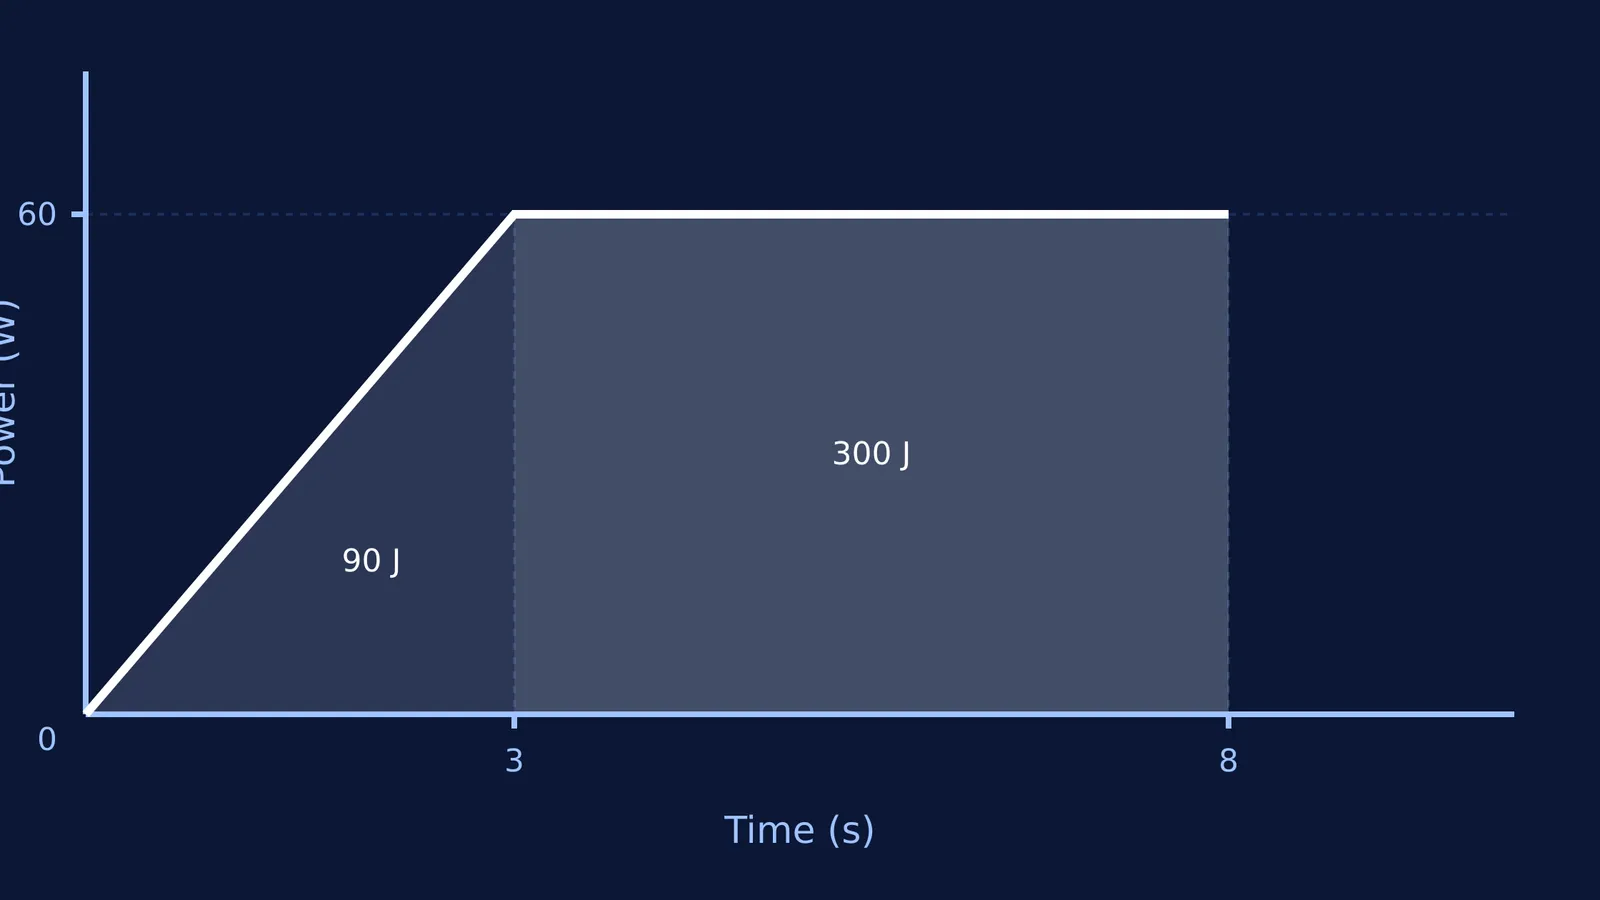
Exam questions in JEE or NEET often present a composite graph combining a triangle and a rectangle. Imagine a power-time graph where the power output increases linearly from 0 to 60 W over the first 3 seconds, remains constant at 60 W from t = 3 s to t = 8 s, and then the graph ends.
To find the total energy transferred over the 8 seconds, you split the shape at t = 3 s.
The first shape is a triangle with a base of 3 s and a height of 60 W. Its area is ½ × 3 × 60 = 90 J.
The second shape is a rectangle with a base of 5 s (from 3 s to 8 s) and a height of 60 W. Its area is 5 × 60 = 300 J.
The total energy transferred is the sum of these areas: 90 J + 300 J = 390 J.
By reading the graph methodically, you save valuable exam time that would otherwise be spent setting up calculus equations.
What happens if the power goes below zero?
Sometimes, a power-time graph dips below the horizontal time axis. This indicates negative power. In mechanical systems, negative power means work is being done on the machine rather than by it (for example, regenerative braking in an electric car absorbing kinetic energy to charge the battery).
When calculating the total net energy transferred by the system, areas below the time axis must be subtracted from the areas above it.
If you find yourself stuck interpreting graphs or struggling with integrals in physics, you can use the Fermi Problem Library. It has worked problems with a step-by-step solver that explains the reasoning rather than printing an answer. Additionally, Fermi's AI tutor works through problems alongside you, drawing the figure and checking understanding as it goes. This is equally helpful when you need to know how to integrate a variable acceleration given as a function of v or when dealing with complex kinematics.


