On this page
When biologists and genetic counselors trace the inheritance of a trait through a family, they rely on a standard visual language. Rather than writing out paragraphs of relationships, they draw a pedigree chart. The word "pedigree" originates from the Anglo-Norman French *pé de grue*, meaning "crane's foot," because the branching lines on early charts resembled a bird's footprint. Today, reading these charts is a fundamental skill for medical professionals and a core requirement for biology students.
To standardize this visual language, the National Society of Genetic Counselors organized the Pedigree Standardization Task Force, publishing the first universal recommendations in 1995. These conventions dictate exactly how males, females, affected individuals, and specific family relationships must be drawn.
What are the basic pedigree chart symbols?
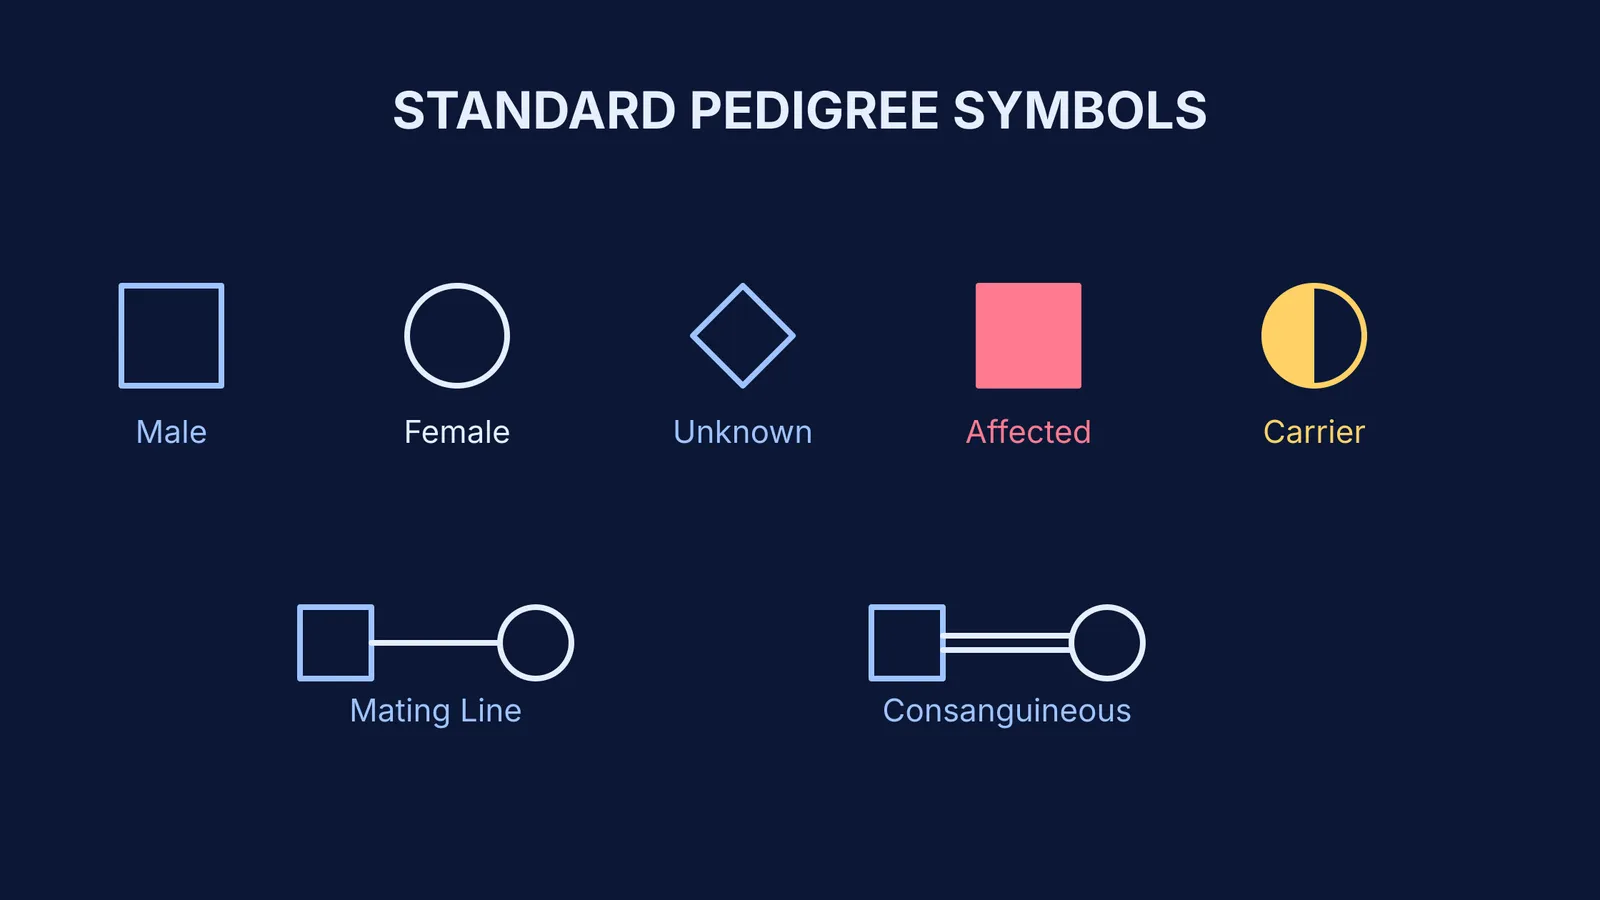
The foundation of any pedigree chart is identifying the sex and health status of each individual. The standard shapes are strictly defined:
Square (□): Represents a male.
Circle (○): Represents a female.
Diamond (◇): Indicates an individual whose sex is unspecified or unknown (often used for early pregnancies or when the information is unavailable).
To show whether an individual has the specific trait or genetic disorder being studied, the symbols are either shaded or left blank:
Shaded/Filled (■ or ●): The individual is "affected," meaning they express the trait or disease.
Unshaded/Blank (□ or ○): The individual is "unaffected" and does not show the trait.
Diagonal Slash (⧄): Indicates that the individual is deceased.
If you are struggling to remember these while studying, you can look them up instantly in the Fermi Concept Library, which covers every concept in physics, chemistry, biology, mathematics and computing.
How do lines show marriage and descent?
Connecting the shapes correctly is just as important as the shapes themselves. Lines in a pedigree chart establish the biological relationships between individuals across generations.
Mating Line: A single horizontal line connecting a male and a female (□—○) represents a mating or marriage.
Consanguineous Mating: A double horizontal line (□═○) indicates a mating between close biological relatives, such as first cousins. This is particularly significant in genetics because it increases the likelihood of recessive traits appearing in offspring.
Descent Line: A vertical line drops down from the center of a mating line to connect parents to their children.
Sibship Line: This horizontal line connects to the bottom of the descent line. Siblings hang from this line like pendants on a necklace, traditionally ordered from left to right by birth order (oldest to youngest).
Generations are usually labeled with Roman numerals (I, II, III) down the left side of the chart, while individuals within a generation are numbered with Arabic numerals (1, 2, 3) from left to right. This allows a specific person to be referenced easily, such as "Individual II-3".
What do half-shaded symbols mean?
Not everyone who carries a disease-causing gene actually shows symptoms. In genetic terms, these individuals are heterozygous carriers of recessive traits. While not always used in basic exam diagrams, clinical pedigrees have specific symbols for carriers:
Half-Shaded Symbol (◧ or ◨): Represents a known carrier of an autosomal recessive trait. They have one copy of the mutated gene and one normal copy, so they are unaffected by the disease.
Dot in the Center (⊙): Used specifically to indicate a female carrier of an X-linked recessive trait (like hemophilia or color blindness).
How is pedigree analysis tested in exams?
For Indian students, pedigree analysis is a crucial part of the Class 12 syllabus, specifically in the NCERT Chapter 5: Principles of Inheritance and Variation. Board exams and competitive tests heavily feature pedigree questions where you must deduce the mode of inheritance.
Here is a practical, three-step checklist for analyzing an unknown pedigree on an exam:
Check for skipped generations: Does the trait skip generations? If unaffected parents have an affected child, the trait is definitively recessive. (The parents are hidden carriers). If every affected child has at least one affected parent, it is likely dominant. If you want to see this in action, review the rules for Mendelian disorders: sickle-cell anaemia, thalassemia and PKU.
Look at the sex ratio: Are males and females affected roughly equally? If so, it is likely autosomal. If significantly more males are affected, suspect an X-linked recessive trait.
Test your hypothesis: Once you suspect a pattern (e.g., autosomal recessive), assign genotypes (like 'Aa' or 'aa') to the individuals in the chart. To figure out an unknown parent's genotype experimentally instead of on paper, learn the difference between a test cross vs back cross: identifying an unknown genotype.
Mastering these symbols transforms a confusing web of lines into a clear, logical map of genetic history.