

On this page
Students moving from simple lines to polynomial curves often meet y = x² (the parabola) and y = x³ (the cubic curve) at the same time. The step up from quadratics to cubics brings new shapes, new symmetry, and new rules for how a graph behaves. Knowing the graph of x cubed vs x squared shape difference gives you a reliable way to sketch harder functions and predict their roots without plotting every point.
What is the graph of x cubed vs x squared shape difference?
The most obvious difference is the overall path the curve takes across the Cartesian plane.
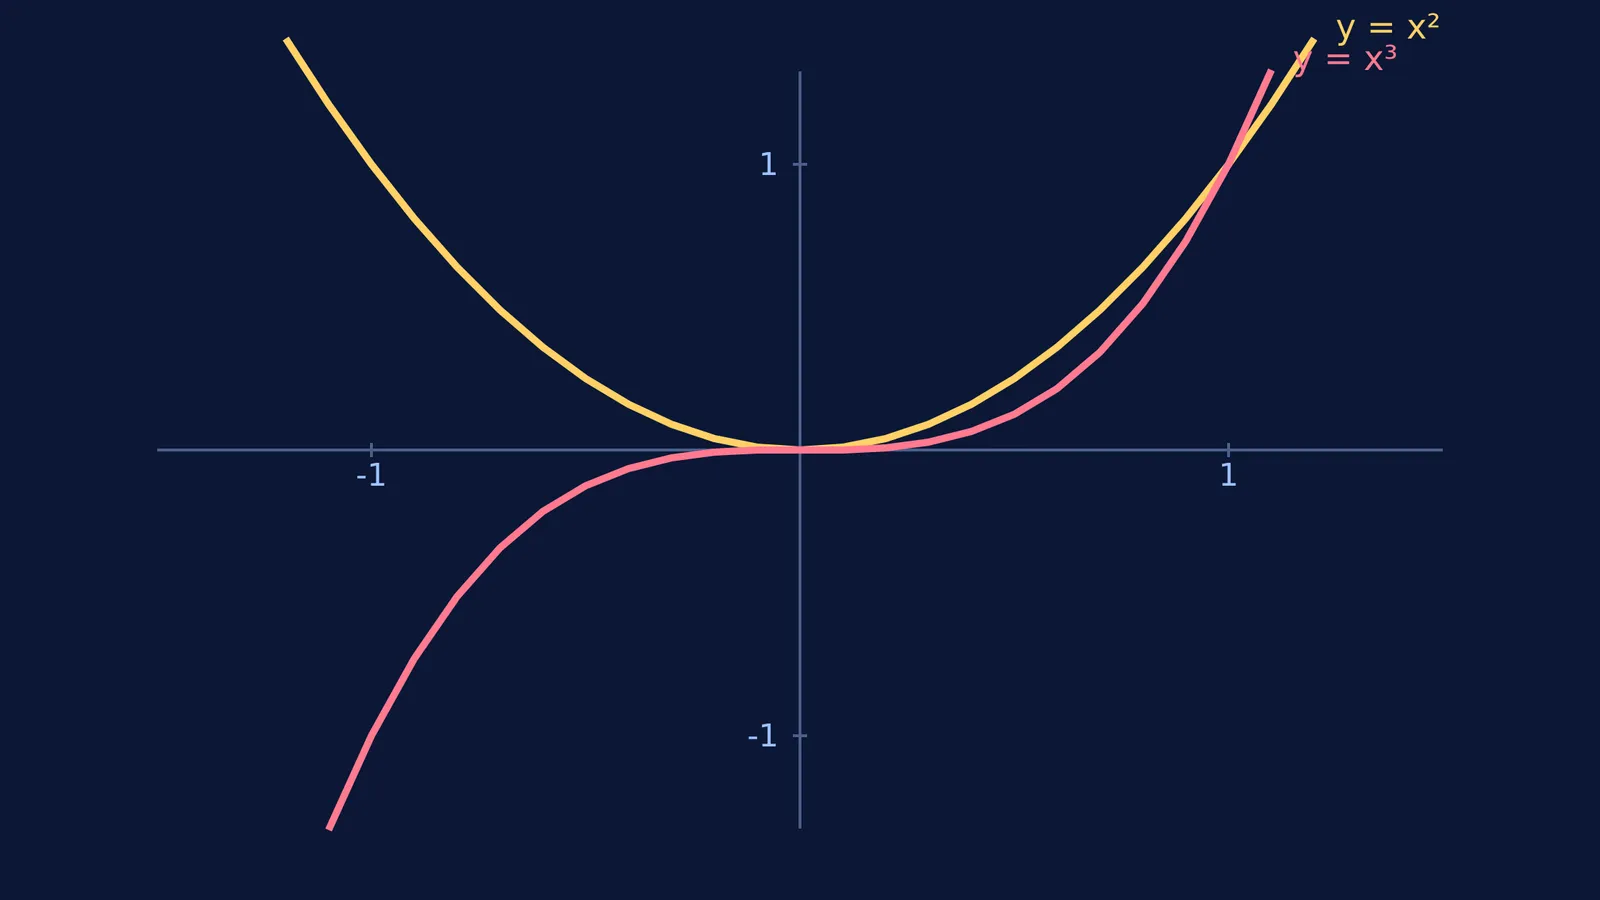
The equation y = x² makes a parabola. Because any real number multiplied by itself is positive, the output is never negative. The graph dips down to the origin (0,0) and goes back up. It sits entirely in the top half of the grid.
The equation y = x³ makes an S-shape. A negative number multiplied by itself three times stays negative (for example, −2 × −2 × −2 = −8). Because of this, the cubic curve climbs up from the bottom left, passes through the origin, and continues into the top right.
How does symmetry change from x² to x³?
The parabola is symmetric about the y-axis. If you fold the graph paper along the vertical axis, the left and right halves match perfectly. This makes it an even function.
The cubic curve is symmetric about the origin. If you rotate the graph 180 degrees around (0,0), it looks exactly the same. This rotational symmetry makes it an odd function.
How do x² and x³ behave between 0 and 1?
The interval between x = 0 and x = 1 is where our usual intuition about powers flips upside down.
Normally, raising a number to a higher power makes it much larger. For x > 1, that is true: 2³ = 8 is larger than 2² = 4. The cubic graph climbs much more steeply than the parabola.
But between 0 and 1, squaring or cubing a proper fraction makes it smaller. For instance, (0.5)² = 0.25, while (0.5)³ = 0.125. Because 0.125 is smaller than 0.25, the cubic curve is actually pulled closer to the x-axis. It sits below the parabola in this narrow window, creating a visibly flatter start before it crosses the parabola at (1,1) and shoots upward.
Why does the graph of x³ have a flat point at the origin?
When you trace the parabola y = x², the origin is a true turning point. The curve stops going down and starts going up, marking a global minimum.
The cubic curve y = x³ does not turn around. It crosses the x-axis, but as it passes through (0,0), it briefly flattens out completely. This is called a point of inflection, where the concavity of the graph changes from facing downward to facing upward. At exactly x = 0, its rate of change (its steepness) drops to zero before picking up again.
What is a checklist for sketching polynomial shapes?
When you face a new polynomial in an exam, use this checklist to sketch its shape before calculating the exact points:
Check the highest power: Is it even or odd? Even means both ends go the same way; odd means they go opposite ways.
Check the sign: What is the sign of the leading coefficient? This tells you where the right-most end points.
Find the roots: Where does the equation equal zero? These are your x-intercepts.
Check the powers of the roots: Does the curve touch or cross the axis? Even powers like (x−2)² touch and bounce, much like when is ax² + bx + c positive for all x?. Odd powers like (x−2)³ flatten and cross.
If you are trying to picture where a curve turns or crosses the axis, the Concept Library can help you map out the rules of polynomials. Instead of just showing you the final plot, Fermi's AI tutor works out what you already know and teaches through it — drawing the figure step by step and checking understanding as it goes. This helps you build the right intuition, which is especially useful when two quadratics share a root or when finding complex intersections.


