

On this page
The naphthalene cooling curve is a classic experiment in high school chemistry and physics. You melt naphthalene powder, let it cool, and record the temperature at regular intervals. When you plot the data, the graph does not go straight down. Instead, it pauses, forming a flat horizontal line before dropping again.
What is the cooling curve of naphthalene?
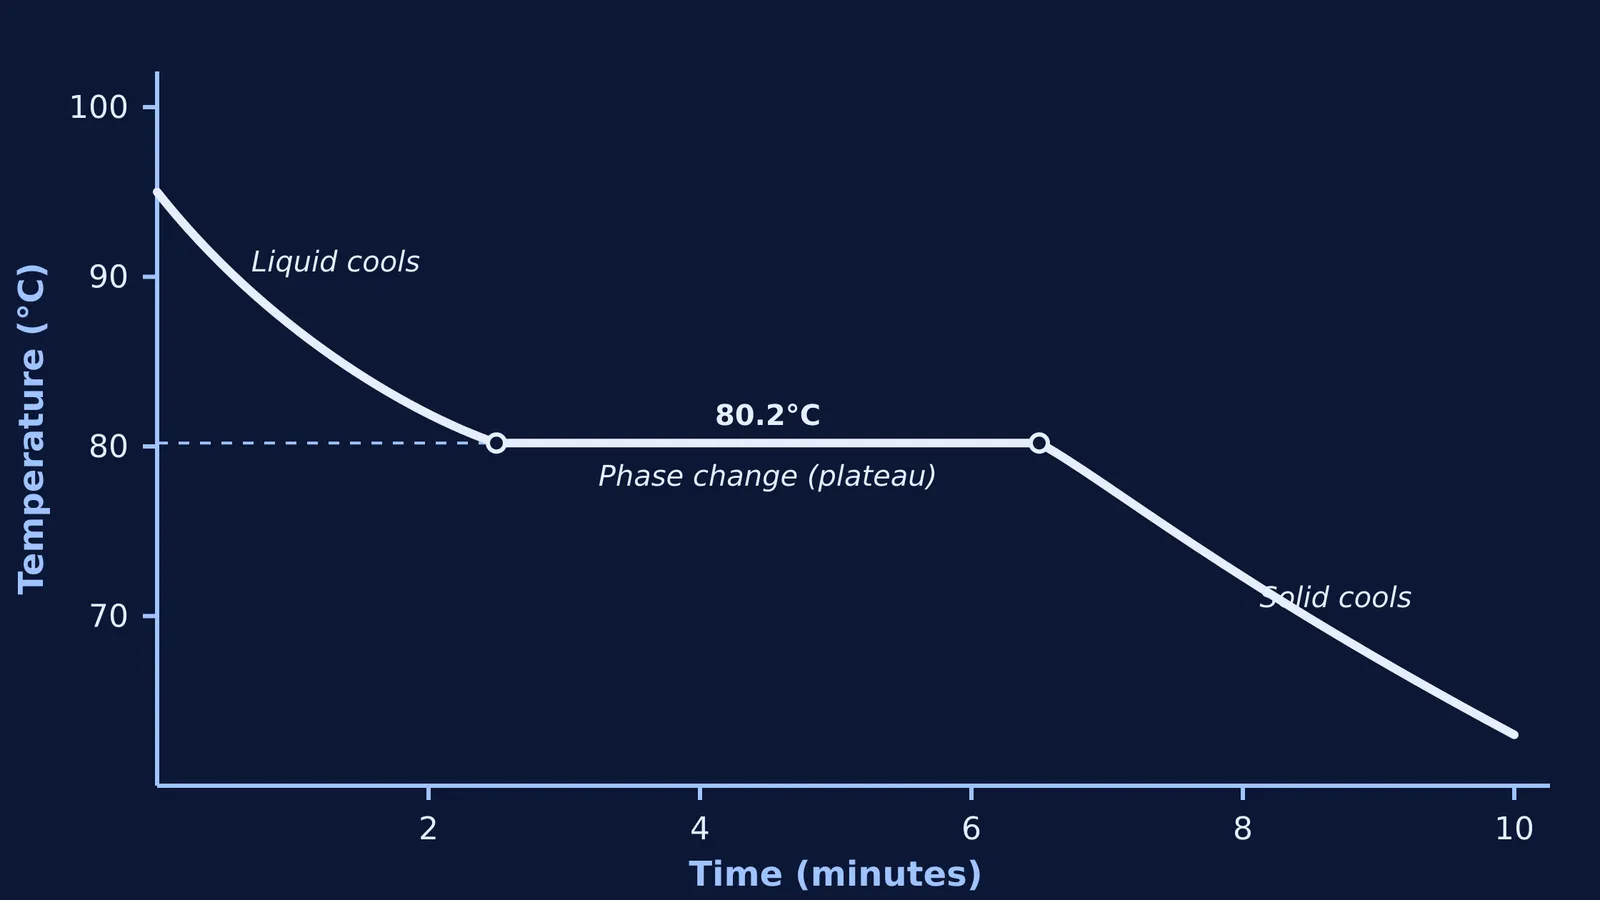
A cooling curve tracks how a substance's temperature changes as it loses heat over time. For naphthalene, the curve has three distinct sections:
Liquid cooling: The molten naphthalene cools steadily from a high temperature down to its freezing point.
The plateau: The temperature stops dropping and stays flat at 80.2°C, which is the standard freezing point according to PubChem. Both liquid and solid naphthalene are present in the tube.
Solid cooling: Once every drop of liquid has frozen, the solid naphthalene cools down to room temperature.
By finding the flat section of the graph, you can determine the exact freezing point of the sample. In a school lab, slight impurities might shift your plateau slightly. Naphthalene is chosen for this practical because its freezing point is conveniently below the boiling point of water, meaning it can be safely melted in a hot water bath without specialized equipment.
Why does the freezing point plateau happen?
When the temperature hits 80.2°C, the liquid naphthalene begins to freeze into a solid, a value confirmed by PubChem. The temperature stops falling, even though the test tube is still losing heat to the cooler air in the laboratory.
This phenomenon occurs because of the latent heat of fusion. Temperature measures the average kinetic energy of the molecules. As the liquid cools, the molecules slow down, which we see as a temperature drop. However, during the phase change, the molecules lock into a rigid crystal structure.
As they form these bonds, the molecules release potential energy. This released thermal energy balances the heat being lost to the room. Because the net heat remains constant, the temperature stays perfectly flat until the phase change is complete. Once solid, the temperature drops again.
If you are struggling to picture how particles rearrange themselves during phase changes, the Concept Library maps out the underlying physics. If you get stuck on the calculations, Fermi's AI tutor can hold a line of reasoning and teach you through it step by step.
How do you plot the cooling curve of naphthalene?
To get a reliable cooling curve, the setup must be controlled. Heat a beaker of water until the naphthalene in your test tube melts completely. Remove the test tube from the water bath and clamp it securely in the air.
Insert a thermometer and start your stopwatch, recording the temperature at regular intervals. On your graph paper, put time on the x-axis and temperature on the y-axis. Connect your data points with a smooth line. The region where the graph goes perfectly horizontal is your freezing point.
How do you avoid supercooling in the experiment?
Sometimes, your graph might dip below the freezing point of 80.2°C (the standard established by PubChem) briefly and suddenly jump back up to form the plateau. This is known as supercooling, where the liquid cools below its freezing point without solidifying. For crystals to start forming, molecules need a nucleation site, like a scratch on the glass. When a crystal finally forms, rapid freezing releases a burst of latent heat, pushing the temperature back up.
To get a clean curve without severe supercooling, follow these steps:
Stir continuously: Gently stir the molten naphthalene with the thermometer. This distributes heat evenly and provides the disturbance needed to prevent supercooling.
Read at eye level: Always look straight across at the thermometer line to avoid parallax errors.
Use an air jacket: Place the hot test tube inside an empty conical flask to cool. The trapped air slows down the rate of heat loss, giving you a wider, clearer plateau.
Leave the thermometer in: Once the naphthalene starts to turn cloudy and freeze, do not pull the thermometer out. It will get stuck in the solid, ruining your final readings.


