

On this page
When you have a long list of numbers, finding the middle is as simple as lining them up and counting inward. But when those values are grouped by how often they occur—a discrete frequency distribution—counting them one by one is too slow. Instead, you can find the median by keeping a running total of the frequencies.
How to find median when values have frequencies?
The median of a discrete frequency distribution is the value that separates the data into two equal halves (Wikipedia, 2024). To find it without writing out every single number, you must create a cumulative frequency (cf) column.
The cumulative frequency is the running total of all frequencies up to that point. By adding each frequency to the sum of the previous ones, you give each value a block of positions in the ordered list.
Arrange the values in ascending order.
Calculate the cumulative frequency (cf) for each row.
Find the total frequency (N), which is the sum of all frequencies.
Determine the median position using N.
Locate the median by finding the first cf that is greater than or equal to the median position. The corresponding value is your median.
If you find yourself stuck setting up the table or getting lost in the running totals, Fermi's AI tutor can work out what you already know and build a plan for the session, stepping through the table construction with you.
What is the formula for the median of discrete data?
The formula you use to find the middle position depends entirely on whether your total frequency (N) is an odd or even number. For a discrete data set of n elements ordered from smallest to greatest, the rules are distinct (Wikipedia, 2024):
If N is odd: The median is the value at the (N + 1)/2 th position.
If N is even: The median is the arithmetic mean of the two middle values, which are located at the N/2 th and the (N/2 + 1) th positions.
Once you have this target position, scan down your cumulative frequency column. The first row where the cf meets or exceeds your target position holds the median value.
Can you show a worked example for an odd total frequency?
Let's say you have a dataset with the following values (x) and frequencies (f):
x = 1: f = 4
x = 2: f = 7
x = 3: f = 5
x = 4: f = 3
First, build the cumulative frequency (cf) column:
x = 1, f = 4, cf = 4
x = 2, f = 7, cf = 4 + 7 = 11
x = 3, f = 5, cf = 11 + 5 = 16
x = 4, f = 3, cf = 16 + 3 = 19
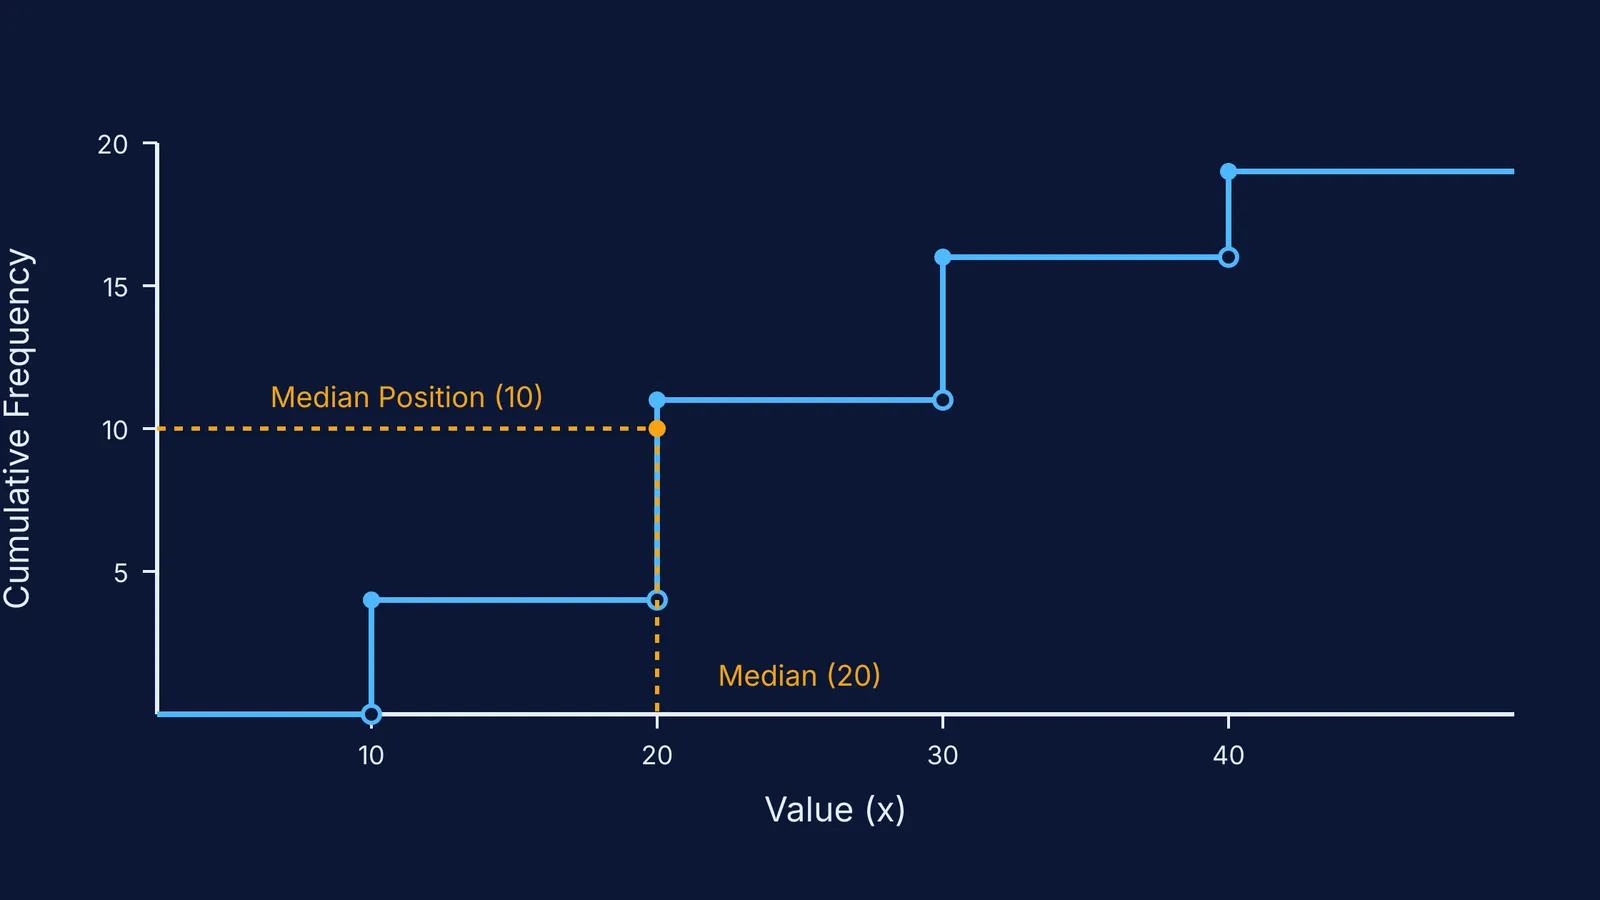
The total frequency N is 19, which is odd. The median position is (19 + 1)/2 = 10.
Now, look at the cf column. The first cumulative frequency that is greater than or equal to 10 is 11, which corresponds to the value x = 2. Therefore, the median of this dataset is 2.
If you want to practice similar problems with guided feedback, the Fermi Problem Library has worked problems with a step-by-step solver that explains the reasoning rather than just printing an answer.
What happens when the total frequency is even?
When N is even, the dataset does not have a single middle value. Instead, it has two.
Imagine a dataset where the total frequency N = 20. The two middle positions are 20/2 = 10 and 20/2 + 1 = 11.
You must find the values at both the 10th and 11th positions in your cumulative frequency table.
If both positions fall within the same cumulative frequency block, the median is just that value.
If the 10th position is at the end of one block (e.g., cf = 10 for x = 5) and the 11th position falls in the next block (e.g., cf = 15 for x = 6), you must take the arithmetic mean of the two values. The median would be (5 + 6)/2 = 5.5.
This case-split method requires careful reading of the table, much like when calculating the mean absolute deviation about the median.
Checklist: Common mistakes to avoid
Understanding how to group and analyze distributions is essential for grasping how adding to or scaling data changes the mean and variance. To ensure your median calculations are always correct, check for these common errors:
Forgetting to sort: Always check that the x values are in ascending order before adding up frequencies.
Stopping at the position: The number you get from (N + 1)/2 is the position of the median, not the median itself. You must find the corresponding x value.
Misreading the even N rule: When N is even, you must find both the N/2 and N/2 + 1 positions. If they fall in different cf rows, you must average the two x values.
Confusing discrete with grouped data: If your data is in class intervals (like 10–20), you need to find the median class first and then apply the continuous data interpolation formula.
Once you find the median, you can visually represent the spread of your data using techniques pioneered by John Tukey and the box plot.


