

On this page
If you look up the official syllabus, such as the NCERT Class 7 Maths textbook, you will find a straightforward definition: the arithmetic mean is the sum of all observations divided by the total number of observations. It is the most common representative value used to summarize a dataset.
But memorising the rule "add and divide" only gets you so far. When you start working with missing numbers or outliers, treating the average as just a calculation can make things confusing. By changing how we picture the mean, the arithmetic becomes much easier to follow.
How to find mean of data class 7?
The standard formula taught in textbooks gives you a simple set of steps. You count how many values you have, add them up to find the total sum, and then divide the sum by the count.
Imagine a student scores 8, 9, 6, and 9 out of 10 in four weekly tests.
Add the observations: 8 + 9 + 6 + 9 = 32.
Count the observations: There are 4 tests.
Divide the sum by the count: 32 / 4 = 8.
The arithmetic mean of the test scores is 8. The mean always lies between the greatest and the smallest observations in the data, giving a sense of the typical score. But what does that number actually represent?
Why think of the mean as a balance point?
In 1995, researchers Jan Mokros and Susan Jo Russell published a study on how children conceptualise averages. They found that while many students could flawlessly execute the "add and divide" algorithm, they did not actually grasp what the mean represented. The researchers identified a more advanced and effective way to understand the average: as a "balance point".
When you view the mean as a physical point of balance on a number line, you start looking at the distances between the data points and the center. The mean is the exact spot where the distances to the left perfectly equal the distances to the right. Mathematically, this means the sum of the deviations from the mean is always zero.
If the formula starts to feel abstract, the Fermi Concept Library contains every concept in physics, chemistry, biology, mathematics and computing, each with its own lesson and its place in the map. It shows exactly how the mean and other measures of central tendency sit in the broader picture.
How does one big value pull the mean?
Seeing the mean as a balance point explains exactly what happens when you introduce an outlier—a value much larger or smaller than the rest.
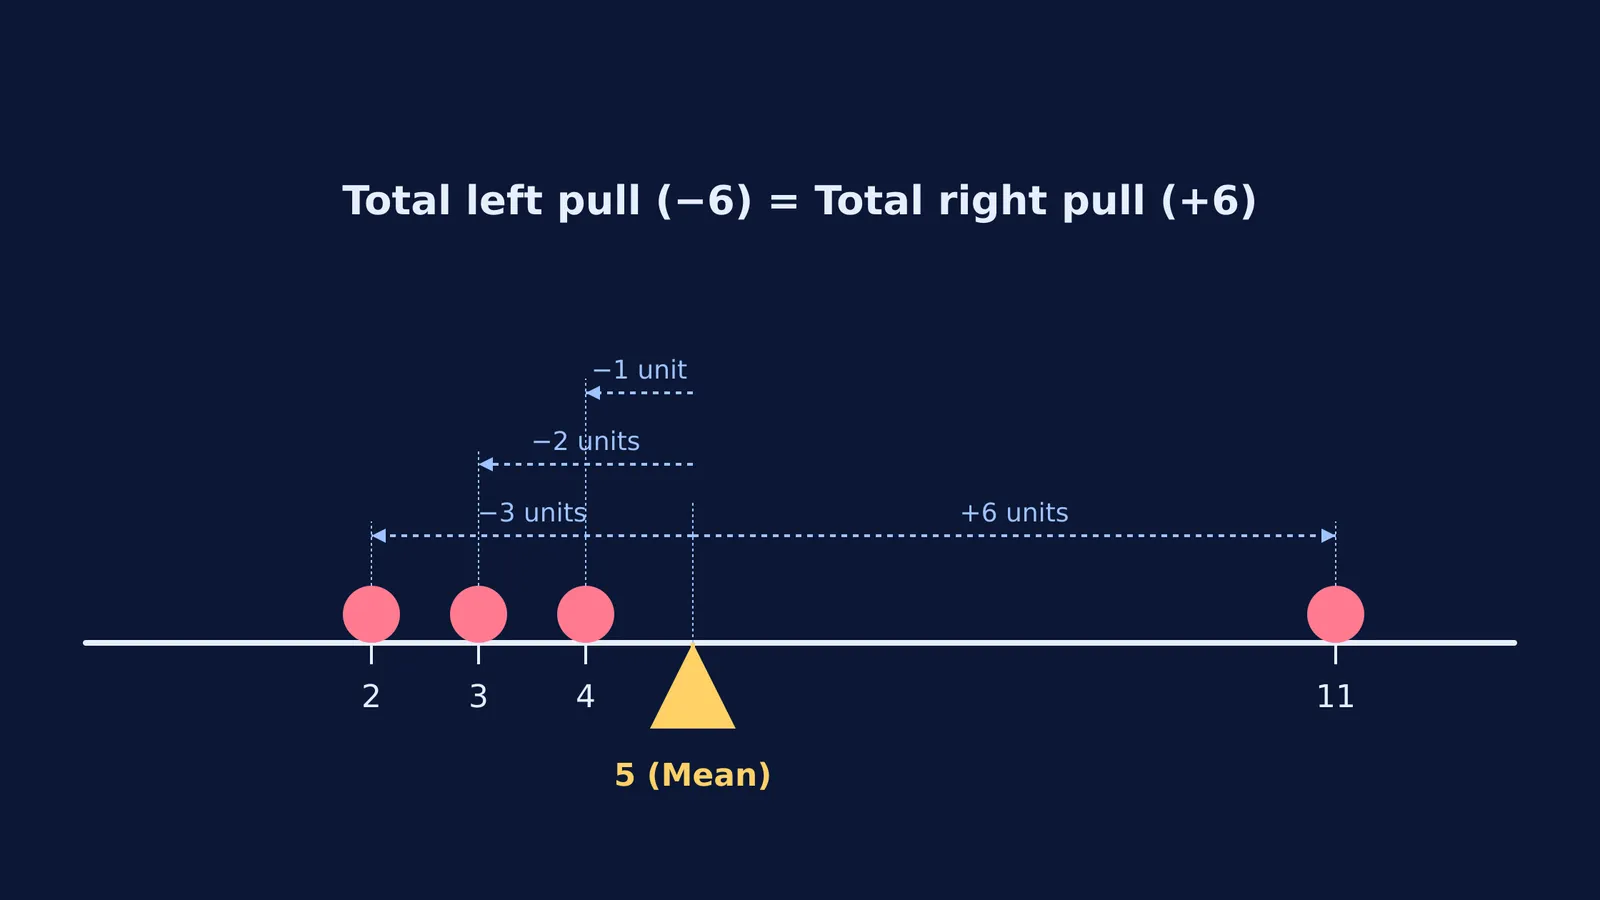
Imagine four friends have ₹2, ₹3, ₹4, and ₹11 in their pockets. Using the formula: (2 + 3 + 4 + 11) / 4 = 20 / 4 = 5. The mean is ₹5.
If we place a fulcrum on a number line at 5, we can check the distances (or deviations):
₹2 is 3 units to the left (−3).
₹3 is 2 units to the left (−2).
₹4 is 1 unit to the left (−1).
₹11 is 6 units to the right (+6).
The total distance to the left is 3 + 2 + 1 = 6. The total distance to the right is 6. The data balances perfectly at 5. Notice how a single large value (₹11) needs three smaller values sitting closer to the center to balance it out. One big observation pulls the balance point firmly in its direction. Later on, understanding this pulling effect is crucial when you learn about changing the mean and variance or when you start calculating the mean absolute deviation about the median for higher-level exams.
How do you find a missing value from the mean?
The balance point framework gives you a quick mental shortcut for finding missing values without heavy algebra.
Let us try a worked example. A batsman has played 5 matches. His scores in the first four matches are 45, 52, 48, and 50. If his mean score across all 5 matches is exactly 50, what did he score in the fifth match?
Instead of setting up an equation like (45 + 52 + 48 + 50 + x) / 5 = 50, you can look at the deviations from the mean of 50:
45 is 5 below (−5).
52 is 2 above (+2).
48 is 2 below (−2).
50 is exactly on the mean (0).
The current balance is −5 + 2 − 2 + 0 = −5. Right now, the data is heavily tilted to the left by 5 units. To balance the scale at zero, the fifth match must tilt the scale 5 units to the right. Therefore, the fifth score must be 5 units above the mean of 50. The fifth score is 50 + 5 = 55.
This way of thinking turns a multi-step algebraic equation into a simple logic puzzle. If you want to practice more missing-value puzzles, the Fermi Problem Library has worked problems with a step-by-step solver that explains the reasoning rather than printing an answer. By focusing on the balance, you learn the actual behaviour of the data, setting up a solid foundation for statistics in the years to come.


