

On this page
In short
To find the mean deviation about the mean for a frequency table, subtract the mean from each class midpoint, take the absolute value, multiply by the class frequency, and divide the sum by the total observations. Calculating the mean deviation about the median always yields a smaller or equal result.
When you summarize a large dataset into a continuous frequency table, you lose the exact individual data points but gain a clear picture of how the data is distributed across different intervals. The mean deviation tells you the average distance between your data points and a chosen central value, giving you a direct measure of dispersion or variability.
While variance and standard deviation square these distances to heavily penalize large outliers, the mean absolute deviation simply takes their absolute values, treating all deviations proportionally. You will most often be asked to calculate this deviation about either the arithmetic mean or the median. Understanding both methods, and how they relate, is a standard part of high school statistics.
What is the formula for mean deviation about mean for grouped data?
For a continuous frequency distribution, the data is grouped into intervals (like 5–15, 15–25). Since you don't know the exact values inside each bin, you use the class midpoint (or class mark) xi to represent them.
The formula for the mean deviation about the mean is: M.D.(x̄) = (1/N) Σ fi |xi - x̄|
Here is what each term means:
fi is the frequency of the i-th class.
xi is the midpoint of the i-th class, found by adding the lower and upper limits and dividing by two.
x̄ is the arithmetic mean of the grouped data.
N is the total frequency (Σ fi).
|xi - x̄| is the absolute value of the difference between the class midpoint and the mean.
If you are struggling with central tendency formulas or want to review the derivations, you can look them up in the Fermi Concept Library, which covers every concept in physics, chemistry, biology, mathematics and computing, each with its own lesson and its place in the map.
How do you calculate mean deviation about the mean for a frequency table?
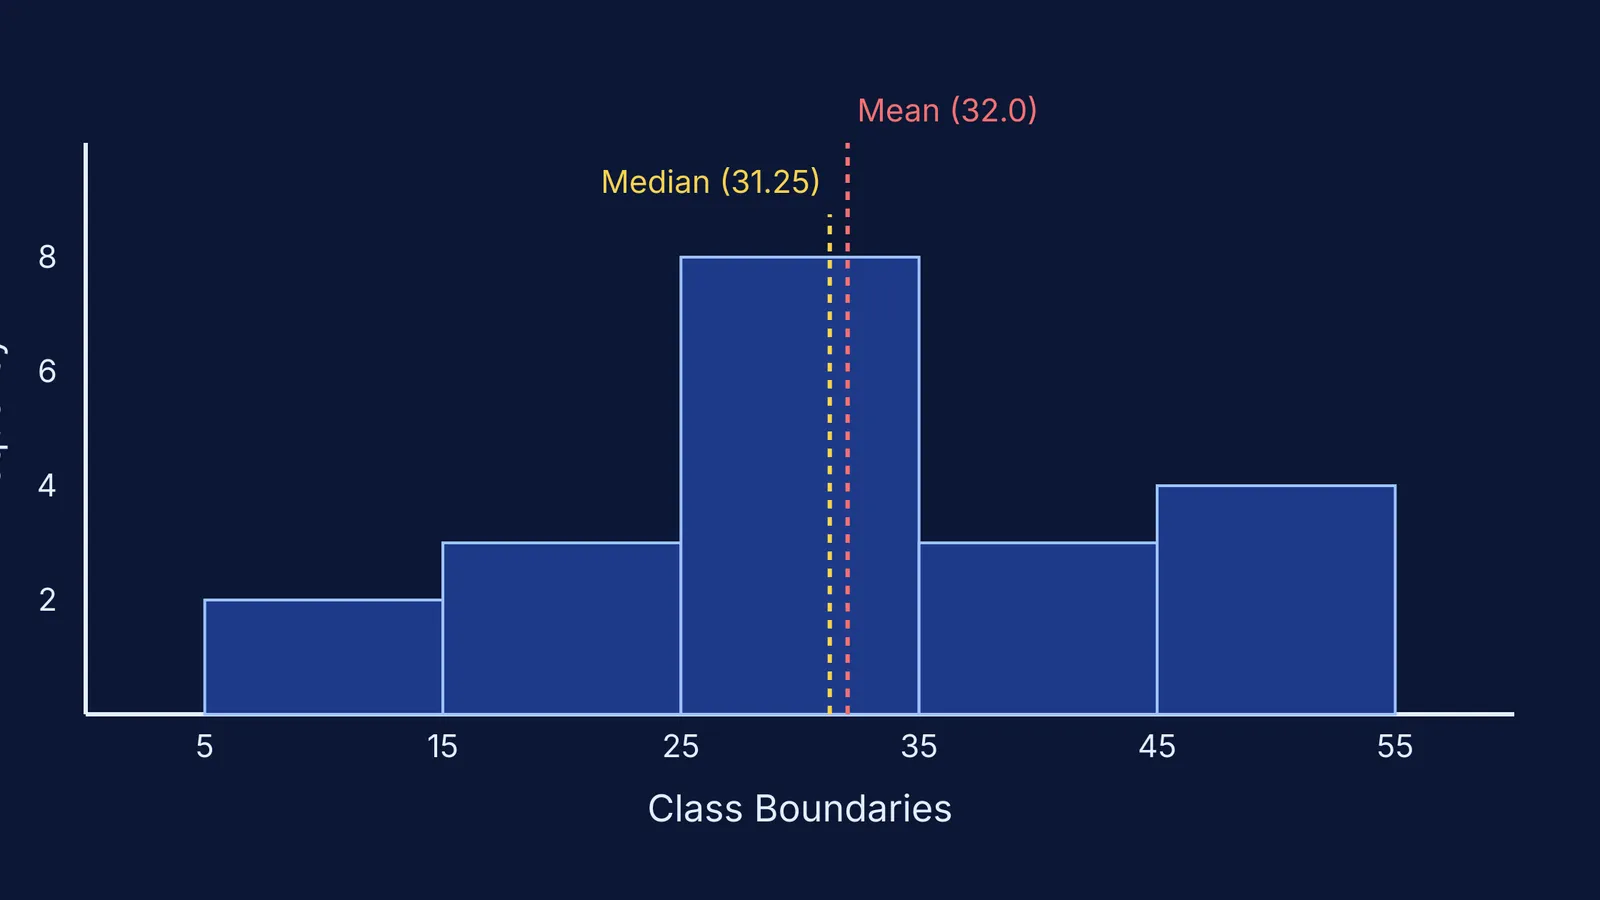
Let's find the mean deviation about the mean for this frequency table:
Classes: 5–15, 15–25, 25–35, 35–45, 45–55
Frequencies (fi): 2, 3, 8, 3, 4
Step 1: Find the midpoints (xi) and the mean (x̄) The midpoints are 10, 20, 30, 40 and 50. The total frequency N is 2 + 3 + 8 + 3 + 4 = 20. Multiply each midpoint by its frequency (fi xi): 20, 60, 240, 120, 200. The sum Σ fi xi is 640. The mean x̄ is 640 / 20 = 32.
Step 2: Find the absolute deviations |xi - x̄| Subtract the mean (32) from each midpoint and drop the negative signs:
|10 - 32| = 22
|20 - 32| = 12
|30 - 32| = 2
|40 - 32| = 8
|50 - 32| = 18
Step 3: Multiply by frequencies and sum Multiply each deviation by its fi:
2 × 22 = 44
3 × 12 = 36
8 × 2 = 16
3 × 8 = 24
4 × 18 = 72
The sum of these products (Σ fi |xi - x̄|) is 44 + 36 + 16 + 24 + 72 = 192.
Step 4: Divide by N M.D.(x̄) = 192 / 20 = 9.6.
If you lose track of the columns and minus signs while calculating group data, the Fermi Problem Library has worked problems with a step-by-step solver that explains the reasoning rather than printing an answer.
Does the median or mean give a smaller mean absolute deviation?
You can also calculate the mean absolute deviation about the median using the exact same table. The formula simply swaps the mean x̄ for the median M: M.D.(M) = (1/N) Σ fi |xi - M|
For our continuous grouped data, the median class is 25–35 (because its cumulative frequency of 13 is the first to pass N/2 = 10). Using the median formula M = l + [(N/2 - C) / f] × h: M = 25 + [(10 - 5) / 8] × 10 = 25 + 6.25 = 31.25.
If we repeat the absolute deviation steps using 31.25 instead of 32: The sum of fi |xi - M| comes out to 187.5. The mean deviation about the median is 187.5 / 20 = 9.375.
Notice that 9.375 is less than 9.6. This is not a coincidence. A fundamental property of statistics states that the mean absolute deviation is always minimized when measured from the median. This minimization property makes the median the natural centre of a dataset when dealing with absolute errors, whereas the mean is the natural centre when dealing with squared errors (such as in variance). Because of this, when outliers are present in your frequency table, the median often provides a more stable baseline for measuring dispersion than the arithmetic mean. (For more on how shifting data affects these measures, see how adding to or scaling data changes the mean and variance and the variance of two combined groups).


