

On this page
When you drop a hydrometer into a liquid, it bobs for a moment before settling at a specific depth. This simple instrument—often a weighted glass tube—is used across industries, from checking the acidity of a car battery to testing the purity of milk.
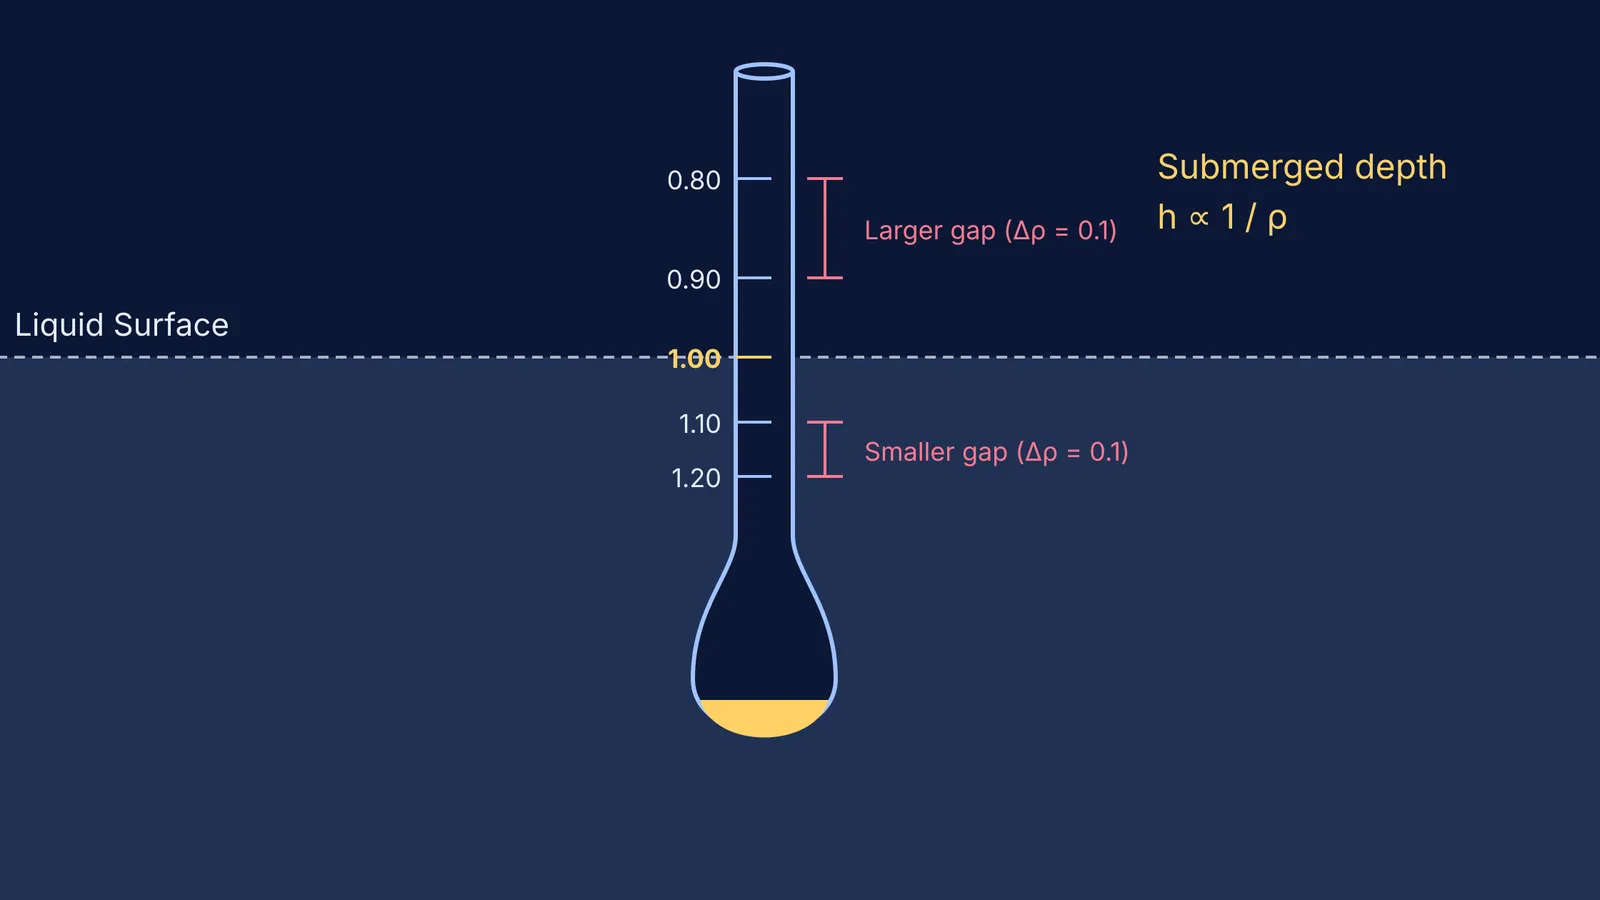
Yet, when you look closely at a hydrometer's stem, you might notice two odd things. First, the highest density numbers are at the bottom of the scale. Second, the lines are not evenly spaced: they are further apart at the top and squashed closer together at the bottom. Understanding why requires a closer look at the physics of floating.
How does a hydrometer measure density of liquid?
A hydrometer relies entirely on Archimedes' principle, which states that a floating object is buoyed up by a force equal to the weight of the fluid it displaces.
Because the hydrometer is a sealed glass tube with a constant weight (usually provided by lead shot or heavy metal in its bulb), it must always displace exactly its own weight in liquid to float.
In a low-density liquid, like alcohol, the liquid is relatively light. The hydrometer must sink deep into the liquid to displace enough volume to equal its weight.
In a high-density liquid, like concentrated sugar syrup, the liquid is heavy. The hydrometer only needs to displace a small volume to support its weight, so it floats higher.
The point where the surface of the liquid intersects the graduated stem gives you the reading. In practical applications, such as checking a lead-acid battery, the hydrometer is often calibrated to read specific gravity relative to water at 16 °C (60 °F) (Wikipedia).
Why does the scale read higher values lower down?
The position of the numbers on the scale is a direct result of how high the instrument floats.
If you place the hydrometer in a dense liquid, it floats high, meaning only a small portion of the stem is underwater. The liquid surface will cross the stem very close to its bottom (near the weighted bulb). Therefore, the marks for high densities—such as 1.100 or 1.200—must be etched near the bottom of the stem.
Conversely, in a light liquid, the hydrometer sinks deep. The liquid surface will cross the stem near its top. As a result, the marks for low densities, like 0.900 or 1.000, are placed at the top.
Why is the scale spacing not even?
The most counter-intuitive feature of a hydrometer is its non-linear scale. The gaps between the density marks shrink as you move down the stem. This happens because the submerged depth is inversely proportional to the liquid's density.
Let the hydrometer have a total mass M, a stem with a uniform cross-sectional area A, and let V_b be the volume of the submerged bulb. When it floats in a liquid of density ρ, the total submerged volume V is given by V = M / ρ.
The submerged depth on the stem, h, is the extra volume divided by the area: h = (1 / A) × (M / ρ − V_b)
Because density (ρ) is in the denominator, a change in density does not produce a constant change in height.
A worked example of the shrinking gap
Imagine a hypothetical hydrometer with a mass of 110 g and a bulb volume of 100 cm³. The stem has a cross-sectional area of 1 cm².
At a density of 1.00 g/cm³ (water): The total displaced volume must be 110 cm³. Since the bulb is 100 cm³, the stem must displace 10 cm³. With an area of 1 cm², the stem sinks by 10.00 cm.
At a density of 1.02 g/cm³: The displaced volume is 110 / 1.02 = 107.84 cm³. The stem sinks by 7.84 cm.
*(The gap between 1.00 and 1.02 is 10.00 − 7.84 = 2.16 cm).*
At a density of 1.08 g/cm³: The displaced volume is 110 / 1.08 = 101.85 cm³. The stem sinks by 1.85 cm.
At a density of 1.10 g/cm³: The displaced volume is 110 / 1.10 = 100.00 cm³. The stem sinks by 0.00 cm (the liquid level is exactly at the top of the bulb).
*(The gap between 1.08 and 1.10 is 1.85 − 0.00 = 1.85 cm).*
Even though the density increased by 0.02 g/cm³ in both steps, the physical gap on the stem shrank from 2.16 cm at the top to just 1.85 cm at the bottom. The graduations become progressively closer together as the density increases.
Seeing the mathematics in the physics
When you first encounter inverse relationships—whether you are dealing with buoyancy, two immiscible liquids in a manometer, or Pascal's law in hydraulic machines—memorising the formula isn't enough to understand the physical behaviour.
When you solve physics problems, Fermi's AI tutor checks your understanding by asking you to predict what happens to an instrument's scale before you calculate the numbers. If you struggle to visualise why an inverse curve flattens out, the Fermi Concept Library connects the raw equations to the physical world, helping you build an intuition for why the gaps must shrink.


