

On this page
When you look at a satellite map of your neighbourhood or a weather forecast on the news, you are not looking at a photograph in the traditional sense. There is no giant lens in space waiting for a shutter to click.
Instead, Earth observation satellites use sophisticated sensors to continuously scan the ground in strips as they fly overhead. Because they orbit outside the atmosphere, they measure wavelengths of light that human eyes cannot see, turning raw electromagnetic signals into data that helps track crop health, urban growth, and water resources across India and the world.
How do satellites scan the Earth?
Most imaging satellites use what is known as a "pushbroom" scanner. Imagine a flatbed scanner moving down the length of a piece of paper. Instead of a page, a satellite like Landsat 8—orbiting roughly 705 km above Earth at speeds near 27,000 km/h—records a narrow strip of the planet's surface at a time. As the satellite moves, these strips, called swaths, are stitched together by computers back on Earth to create a continuous, global map.
This continuous operation relies on the physics of gravitation and satellites. By maintaining an exact altitude and orbital speed in a "sun-synchronous" orbit, satellites can revisit the same spot on Earth at the exact same local time every few days. This consistent sun angle is crucial. It ensures that any change in an image over time is due to real changes on the ground (like a forest being cleared) rather than shadows shifting throughout the day.
How do satellites use the electromagnetic spectrum?
Human eyes only detect visible light, which is made up of red, green, and blue wavelengths. Satellites, however, can read a much wider range of the electromagnetic spectrum.
Sensors on satellites act like incredibly precise light meters. "Passive" sensors measure the sunlight that bounces off the Earth's surface. However, not all sunlight makes it back to space. Atmospheric gases like carbon dioxide and water vapour absorb many wavelengths completely. Fortunately, there are specific wavelengths that pass through the atmosphere cleanly in what scientists call "atmospheric windows." According to NASA's Earth Observatory, remote sensing instruments are specifically tuned to look through these transparent windows to collect clear data from the surface.
When this reflected energy hits the satellite's sensors, the intensity of light is quantified into digital numbers. This numerical data is beamed down to ground stations via radio waves, and only then is it processed by software to create the visual colours we recognise as images.
What is the difference between true and false colour?
Because satellites record multiple bands of light separately, scientists can combine them in different ways. If they combine the red, green, and blue data bands, they produce a "true-colour" image. This looks exactly like what an astronaut would see when looking out of the window of the International Space Station.
However, the real power of satellite data lies in "false-colour" images. By swapping a visible light band for an invisible one—such as mapping infrared data to the colour red—scientists can suddenly reveal patterns that are entirely invisible to the naked eye. In these false-colour images, healthy forests might glow bright red, while cities appear as dull grey patches and deep water looks completely black.
Why does infrared matter for crops and water?
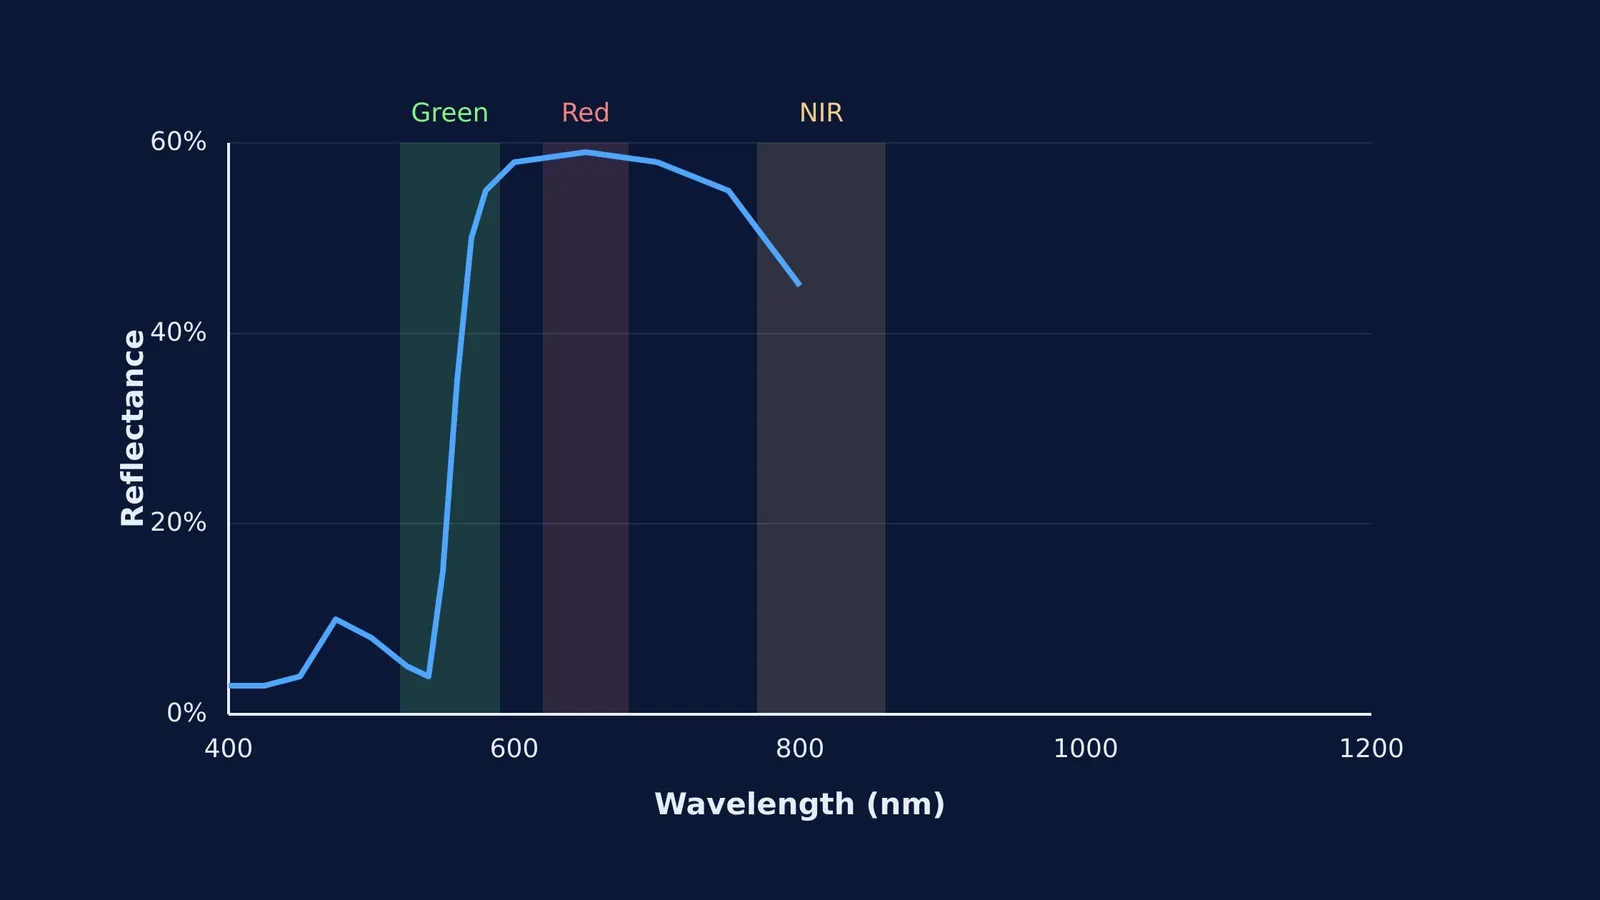
Every material on Earth reflects and absorbs light differently. This unique "spectral signature" is why seeing beyond visible light is so critical for a country heavily dependent on agriculture.
For example, ISRO's Resourcesat-2 uses three specific bands (green, red, and near-infrared) to manage India's land and water resources. The biology of a plant dictates how it interacts with these bands. A healthy leaf absorbs mostly red and blue light to power photosynthesis, which is why it reflects green light to our eyes. But more importantly, the spongy cell structure inside the leaf strongly reflects Near-Infrared (NIR) light to avoid overheating.
By comparing the amount of red light absorbed with the immense amount of NIR light reflected, scientists can instantly map plant health across entire states. If a region's NIR reflection drops, it serves as a massive early warning sign for drought, pest infestations, or crop failure—long before the crops actually wilt and turn brown to human eyes.
Seeing the physics in action
Understanding how a satellite reads invisible waves requires a solid grasp of how light, energy, and matter interact. If you are struggling to picture how different wavelengths behave, how atmospheric windows allow energy to escape, or how absorption works, the Fermi Simulation Lab has interactive simulations for the ideas that are easier to see than to read. You can interact with live models of the electromagnetic spectrum, changing variables dynamically to see exactly how energy travels and reflects off different surfaces.
The next time you pull up a satellite map on your phone, remember you are not just looking at a picture. You are looking at billions of digital measurements of the electromagnetic spectrum, beamed down from a scanner flying hundreds of kilometres above your head.


