

On this page
A function like |x + 1| + |x − 2| + |x − 4| looks messy, but its graph is just straight lines joined at a few corners. Once you see why, you can sketch it fast and read off the minimum.
Why is the graph made of straight lines?
The modulus function is defined piecewise: |x| = x when x ≥ 0 and |x| = −x when x < 0. The absolute value article notes that this function is piecewise linear and continuous everywhere, but not differentiable at x = 0. So its graph is a V with a corner at the origin.
Shift it and |x − a| is the same V with its corner at x = a. It also has a meaning: |a − b| is the distance between a and b on the number line (same source). Our guide to graph transformations for JEE covers shifts.
Between two corners every bracket keeps its sign, so each term is linear and so is their sum. The sum can only bend at the critical points, where some bracket equals zero.
How do you draw the graph of a sum of modulus functions?
Find the critical points. Set each bracket equal to zero and sort the answers on a number line.
Find the slope in each region. Each term k|x − a| (with k > 0) adds +k to the slope to the right of a and −k to the left. With all coefficients 1, the slope is (points on your left) minus (points on your right).
Work out f at the critical points. These are the corners of the graph.
Plot the corners, join them, and draw the two end rays. The far-left slope is minus the sum of the coefficients; the far-right slope is plus that sum.
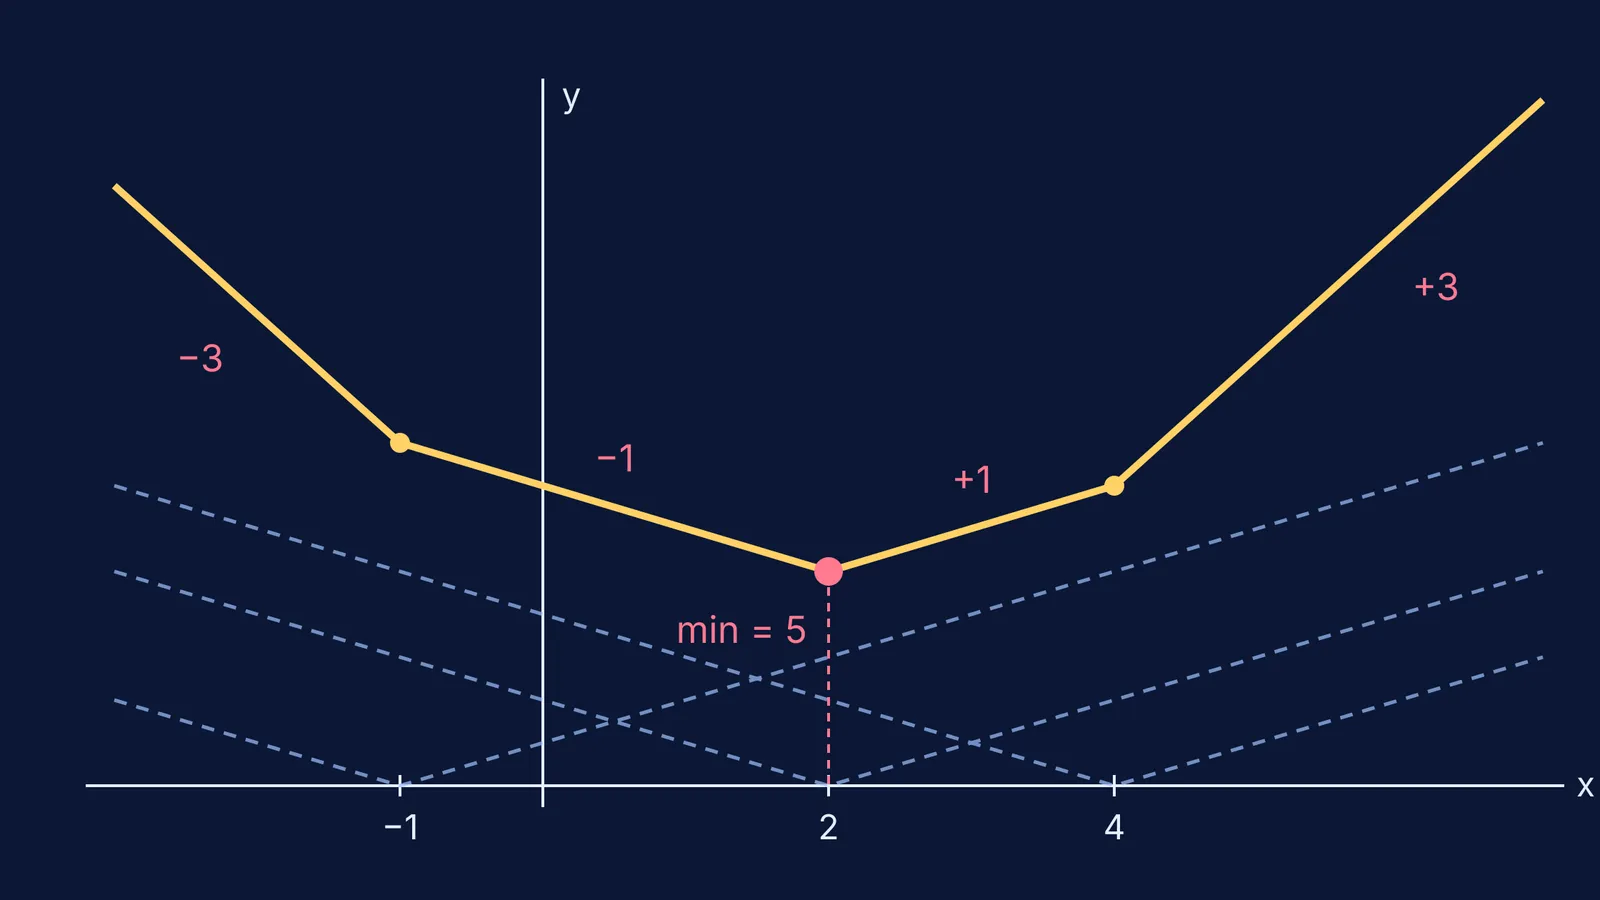
Worked example: f(x) = |x + 1| + |x − 2| + |x − 4|
The critical points are x = −1, 2 and 4. Open each bracket with the right sign in each region:
For x < −1: f(x) = −(x + 1) − (x − 2) − (x − 4) = −3x + 5
For −1 ≤ x < 2: f(x) = (x + 1) − (x − 2) − (x − 4) = −x + 7
For 2 ≤ x < 4: f(x) = (x + 1) + (x − 2) − (x − 4) = x + 3
For x ≥ 4: f(x) = 3x − 5
The slopes run −3, −1, +1, +3, as the counting shortcut predicts. The corners are (−1, 8), (2, 5) and (4, 7). Join them and add a ray of slope −3 going left and one of slope +3 going right.
The slope turns from negative to positive at x = 2, so the minimum value is 5 and the range is [5, ∞).
The graph also solves equations: f(x) = 6 has two solutions, x = 1 and x = 3, because the line y = 6 cuts the graph twice. f(x) = 4 has none, because 4 is below the minimum. Our post on solving modulus equations and inequalities shows the algebra side.
Where is the minimum of |x − a| + |x − b| + |x − c|?
Each term is a distance, so f(x) is the total distance from x to a, b and c. The median article states that a sample median minimises the mean of the absolute deviations, and that with an even number of values this minimiser is not unique.
That gives a quick rule for equal coefficients:
Odd number of terms: the minimum is at the middle critical point. In the example that is x = 2.
Even number of terms: the graph is flat between the two middle points. For |x − 1| + |x − 3|, f(x) = 2 for every x from 1 to 3.
Unequal coefficients: count a term with coefficient k as k copies of that point. For |x − 1| + 2|x − 3|, the points are 1, 3, 3, so the minimum is at x = 3 and equals 2.
For the statistics side, see our explainer on mean absolute deviation about the median.
What mistakes cost marks?
Using the midpoint instead of the median. The midpoint of −1 and 4 is 1.5, but f(1.5) = 5.5, not 5.
Forgetting to factor out coefficients. |2x − 6| = 2|x − 3|, so it counts as two copies of the point 3.
Getting a sign wrong. To the left of a critical point, that bracket is negative, and so is every bracket with a larger critical point.
If a region's line comes out wrong, the Fermi Problem Library has worked problems with a step-by-step solver that explains the reasoning rather than printing an answer. To revise the modulus function itself, try the Fermi Concept Library, where each mathematics concept has its own lesson.
Try it now: sketch |x| + |x − 1| + |x − 5| + |x − 6| and check that its minimum is a flat segment.


