

On this page
When a problem asks for the graph of the max of two functions—such as f(x) = max(g(x), h(x))—it is defining a new piecewise function. In mathematics, a piecewise function is a function whose domain is partitioned into several intervals on which the function may be defined differently. For a maximum function, the rule simply changes depending on which curve sits higher on the Cartesian plane.
We can solve these problems by drawing both curves and finding their crossing points.
How to find the graph of the max of two functions?
To build the graph of f(x) = max(g(x), h(x)):
Plot both g(x) and h(x) lightly on the same set of axes.
Find their points of intersection by setting g(x) = h(x) and solving for x. These points mark the boundaries where the maximum shifts from one function to the other.
Test a point in each interval between the intersections to see which function gives a larger value.
Draw a solid line over the upper curve in each interval.
The same logic applies to f(x) = min(g(x), h(x)), except you draw a solid line over the lower curve.
If the curves are hard to picture, you can run an interactive simulation in the Fermi Simulation Lab to see how the highest and lowest values shift as x changes.
Worked example: max(x, x²)
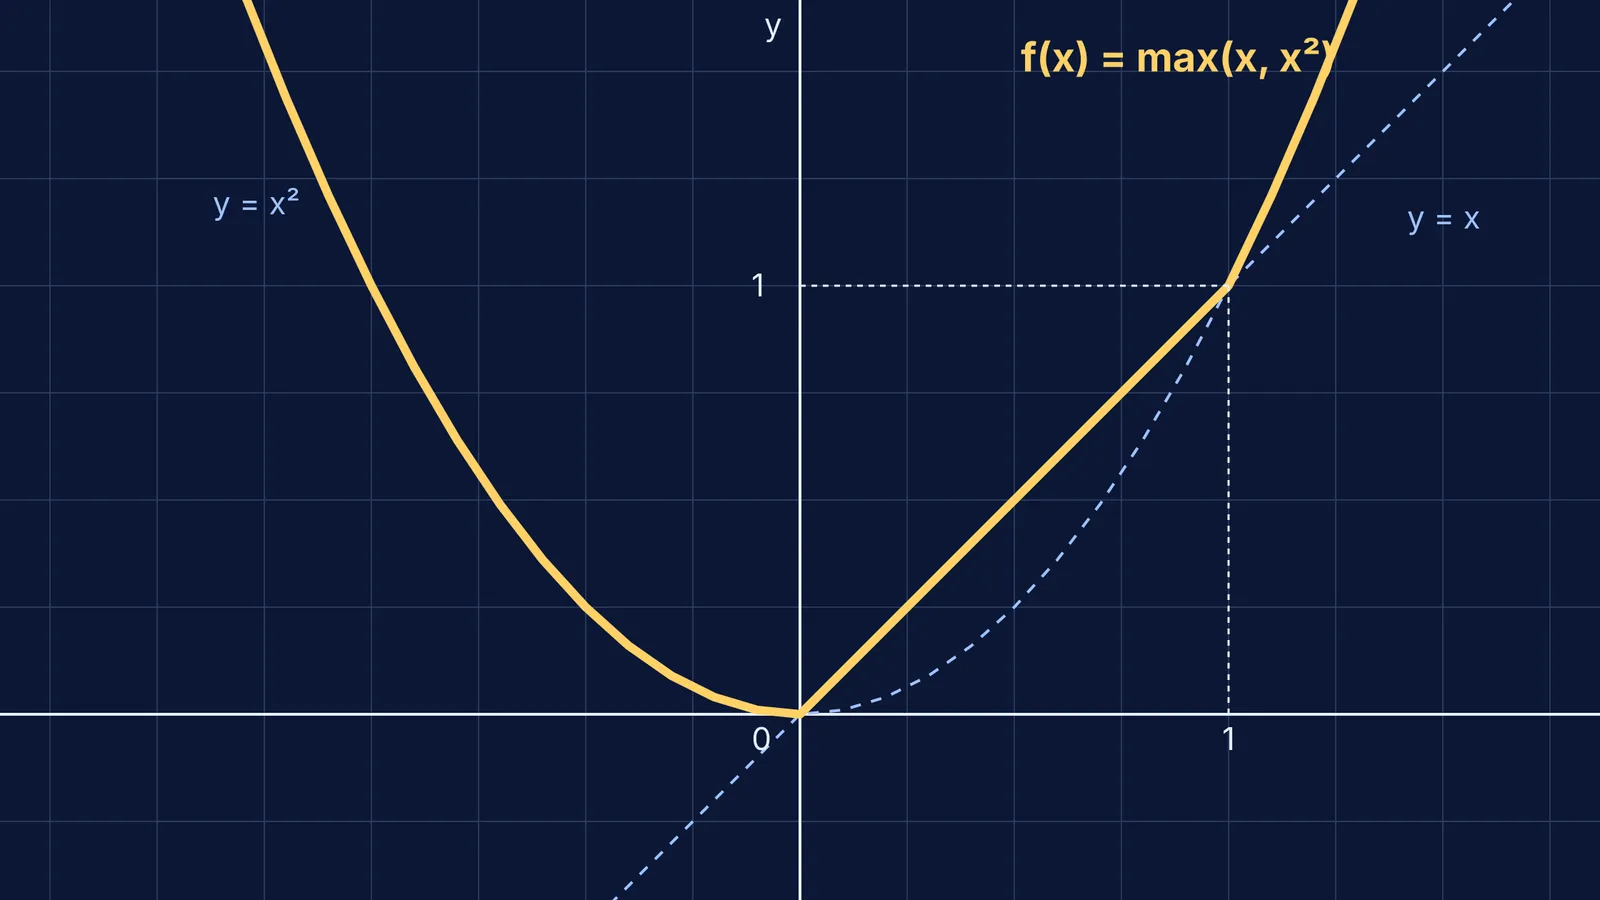
Let's find the graph of f(x) = max(x, x²). First, we plot g(x) = x (a straight line through the origin) and h(x) = x² (an upward-opening parabola). We find the crossing points by solving x = x²: x² − x = 0 x(x − 1) = 0 The curves intersect at x = 0 and x = 1. This splits the x-axis into three intervals:
x < 0: For negative numbers, x² is positive while x is negative. For instance, (−2)² = 4, which is greater than −2. The parabola is higher, so the max is x².
0 < x < 1: For fractions between zero and one, x is larger than x². For example, 1/2 is greater than 1/4. The line is higher, so the max is x.
x > 1: For numbers greater than one, the square grows much faster than the number itself. The parabola is higher again, so the max is x².
The final graph consists of the parabola for x < 0, the straight line for 0 < x < 1, and the parabola again for x > 1.
Worked example: min(|x|, 1)
Functions involving absolute values often show up in piecewise problems. Consider f(x) = min(|x|, 1). Here, g(x) = |x|, which is a V-shaped graph with its vertex at the origin. The second function is h(x) = 1, a horizontal line one unit above the x-axis. Setting |x| = 1 gives intersections at x = −1 and x = 1.
x < −1: The V-shape is above the horizontal line. We want the minimum, so we keep the horizontal line (h(x) = 1).
−1 < x < 1: The V-shape dips below the horizontal line. We keep the V-shape (g(x) = |x|).
x > 1: The V-shape goes back above the horizontal line. We keep the horizontal line again (h(x) = 1).
The resulting graph looks like a flat line at y = 1 that dips down to touch the origin and goes back up to a flat line. If you struggle to count intersections when polynomials meet absolute values, the Fermi Concept Library holds guides on sketching these shapes efficiently.
You can often use these piecewise graphs to solve complicated equations visually. For more on this, see how to find roots by curve intersections and the method for solving modulus equations and inequalities.
How to find the max or min of three functions?
Sometimes an exam question might ask you to graph the maximum of three or more functions, such as f(x) = max(x, x², 1). The process remains the same, but the tracking step requires a little more care.
Sketch all three graphs on the same Cartesian plane.
Find every point where any two of the curves cross.
For a maximum function, imagine a light shining down from the top of the y-axis. The regions that the light hits first form the graph of the max. For a minimum function, imagine the light shining up from the bottom; the shapes it hits make up the min.
If we look at f(x) = max(x, x², 1), we have our parabola, our diagonal line, and a horizontal line at y = 1. The highest boundary will simply ride the parabola for x < −1, flatten out along y = 1 between x = −1 and x = 1, and then ride the parabola again for x > 1. The diagonal line y = x never becomes the highest function because whenever x is between 0 and 1, the constant 1 is larger than x.
How to find extrema from the graph?
When you draw a max or min graph, the result often has sharp corners—called cusps or jump discontinuities—at the intersection points. Because of these corners, the new function is usually not differentiable everywhere, even if the original functions were perfectly smooth.
However, sketching the graph makes it very easy to find the greatest and least values of the new function. The lowest point on the trace is the absolute minimum, and the highest point is the absolute maximum. Pierre de Fermat was one of the first mathematicians to propose a general technique, adequality, for finding the maxima and minima of functions, but visually finding the highest and lowest points on a graph requires no calculus. If the problem sets a restricted domain, you can check the endpoints exactly as you would for absolute extrema on a closed interval.


