

On this page
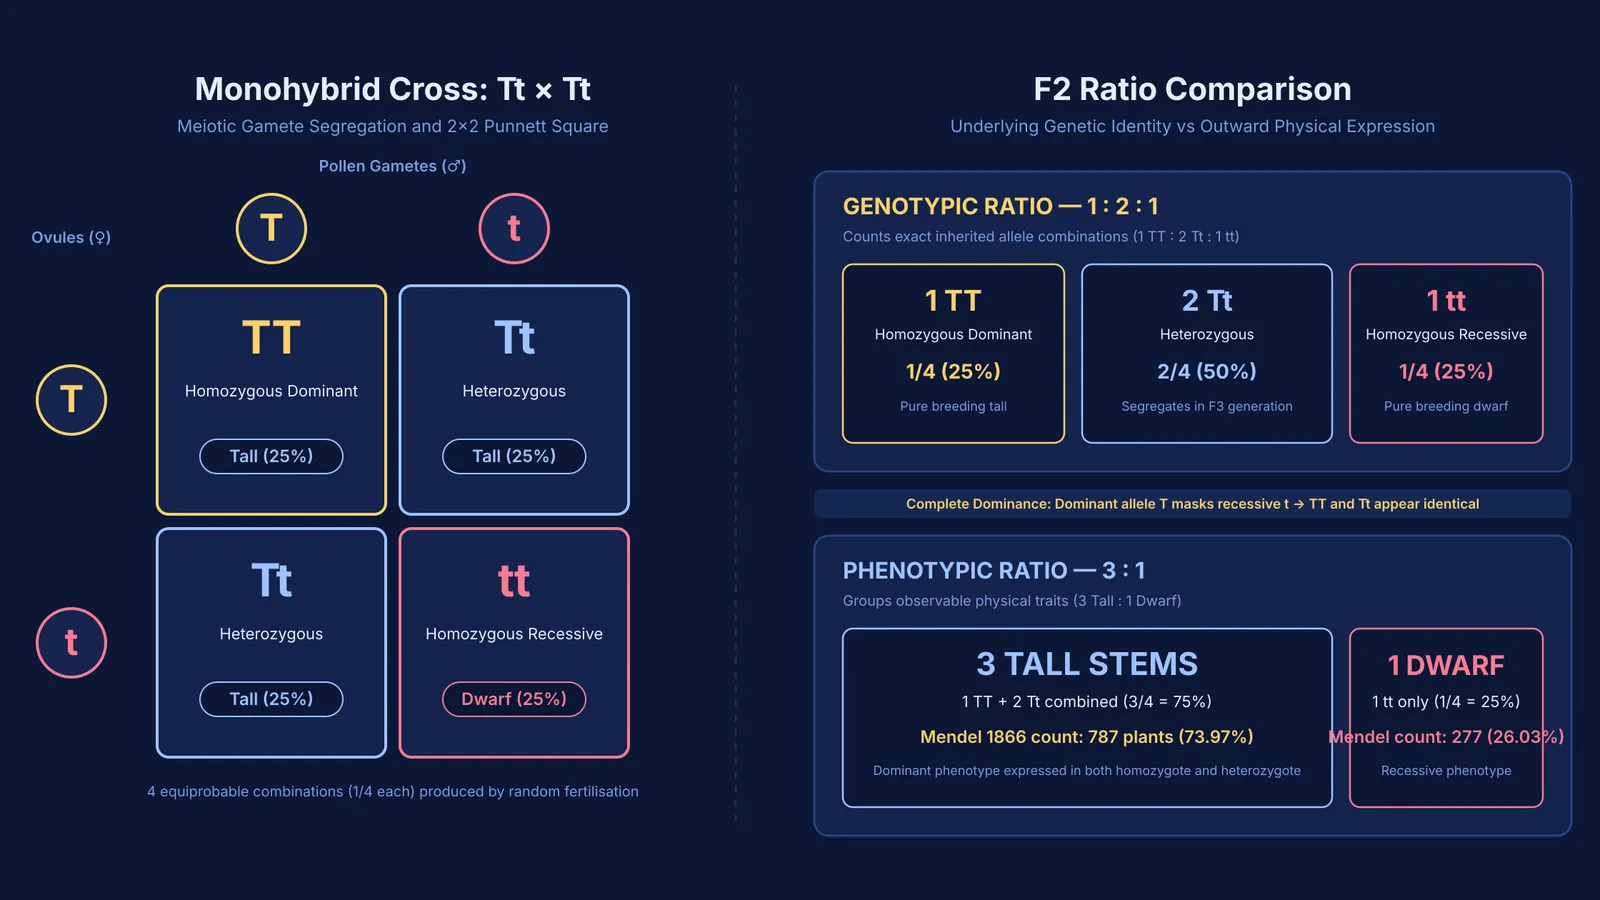
When Gregor Mendel tracked traits across generations of garden peas (*Pisum sativum*), he discovered that outward appearance does not always reveal inherited genetic instructions. In a classic monohybrid cross, two distinct distributions describe the second filial (F2) generation: the genotypic ratio tracks inherited allele combinations, while the phenotypic ratio describes outward physical traits.
Confusing these two distributions is a frequent error in biology exams. Understanding the meiotic mechanics behind each ratio—and applying a simple product rule—allows you to solve monohybrid and multi-gene questions quickly without drawing oversized grid tables.
What is the difference between a genotypic and phenotypic ratio?
Genotype specifies an organism's allelic composition, while phenotype refers to the observable physical characteristic resulting from that gene expression (Lewis and Kattmann, 2004). In the *International Journal of Science Education*, researchers Jenny Lewis and Ulrich Kattmann showed that students frequently treat genes as miniature physical particles rather than instructional codes, leading them to conflate the genetic instructions with physical traits.
Uppercase letters denote dominant alleles and lowercase letters denote recessive alleles. For pea plant height:
Homozygous dominant (TT): Two dominant alleles; produces a tall plant.
Heterozygous (Tt): One dominant and one recessive allele; produces a tall plant because the dominant allele masks the recessive one in complete dominance.
Homozygous recessive (tt): Two recessive alleles; produces a dwarf plant.
Because *TT* and *Tt* plants look identical, three distinct genotypes produce only two distinct phenotypes. This distinction is central to understanding the origins of Reginald Punnett's square.
How do you find the ratios for a monohybrid cross?
To find the ratios in a monohybrid cross, start with true-breeding parents: tall (*TT*) and dwarf (*tt*). Meiosis separates alleles into gametes, producing a first filial (F1) generation that is 100% heterozygous (*Tt*) and phenotypically tall.
When F1 plants self-pollinate (*Tt* × *Tt*), each parent produces *T* and *t* gametes in equal 50% frequencies. A 2×2 Punnett square yields four combinations:
One *TT* combination (25% of offspring).
Two *Tt* combinations (50% of offspring).
One *tt* combination (25% of offspring).
This produces the genotypic ratio of 1 TT : 2 Tt : 1 tt (1:2:1).
Grouping these genotypes by physical appearance gives the phenotypic ratio of 3 Tall : 1 Dwarf (3:1), because the one *TT* and two *Tt* plants both display the dominant trait.
In his 1866 paper translated in *Genetics*, Gregor Mendel self-fertilized F1 tall hybrids and counted 787 tall and 277 dwarf plants across 1,064 F2 offspring—an empirical 2.84:1 split closely matching the theoretical 3:1 expectation. When Mendel grew these plants into the F3 generation, one-third of tall plants bred true (*TT*) while two-thirds segregated tall and dwarf offspring in a 3:1 pattern (*Tt*), confirming the 1:2:1 genotypic ratio.
To explore how allele interactions shape inheritance across cell division, the Fermi Concept Library covers every concept in physics, chemistry, biology, mathematics and computing, each with its own lesson and its place in the map.
Why do students confuse 1:2:1 and 3:1 on exams?
In *The American Biology Teacher*, James H. Stewart demonstrated that students frequently learn to fill out Punnett squares algorithmically without connecting letters to meiotic chromosome movement, leading them to transpose genotypic (1:2:1) and phenotypic (3:1) outputs under time pressure. Furthermore, Michelle K. Smith, William B. Wood, and Jennifer K. Knight (2008) in *CBE—Life Sciences Education* tested over 600 students with the Genetics Concept Assessment, showing that separating allelic identity from trait expression remains a persistent stumbling block.
Three recurring traps cause lost marks:
Incomplete dominance: In snapdragons (*Antirrhinum majus*), crossing red (*RR*) and white (*rr*) flowers yields pink (*Rr*) F1 hybrids. In F2, the phenotypic ratio is 1 Red : 2 Pink : 1 White (1:2:1)—matching the genotypic ratio because heterozygotes show an intermediate trait. Assuming 3:1 is universal causes errors on topics like polygenic inheritance and pleiotropy.
Test cross versus self-cross: A test cross mates a dominant phenotype with a homozygous recessive individual (*Tt* × *tt*), yielding a 1:1 genotypic and 1:1 phenotypic ratio (1 Tall : 1 Dwarf), rather than 1:2:1 or 3:1.
Probability versus small samples: Punnett ratios represent statistical probabilities, not guaranteed quotas in small families.
Checking whether a question asks for genotypes, phenotypes, or gamete frequencies is essential when eliminating options in NEET biology questions.
How can you calculate multi-gene ratios without a Punnett square?
Drawing a 16-box grid for a dihybrid cross (*AaBb* × *AaBb*) takes valuable exam time and invites errors. Because unlinked genes assort independently during meiosis, you can find multi-gene ratios using the product rule of probability.
To find the phenotypic ratio for a dihybrid cross (*AaBb* × *AaBb*), multiply the independent monohybrid ratios: (3 Dominant : 1 Recessive) × (3 Dominant : 1 Recessive) = 9 : 3 : 3 : 1.
To find the genotypic ratio, multiply the two single-gene 1:2:1 distributions: (1 *AA* : 2 *Aa* : 1 *aa*) × (1 *BB* : 2 *Bb* : 1 *bb*) = 1:2:1:2:4:2:1:2:1.
Use this three-step routine on exam day:
Split the cross: Separate multi-gene crosses into independent single-gene pairs.
Assign branch fractions: Note the single-locus genotypic (1/4, 1/2, 1/4) or phenotypic (3/4, 1/4) fractions.
Multiply branch probabilities: Multiply the individual fractions to calculate any requested combination directly.
When tackling complex inheritance problems, the Fermi Problem Library provides worked problems with a step-by-step solver that explains the reasoning rather than printing an answer.


