

On this page
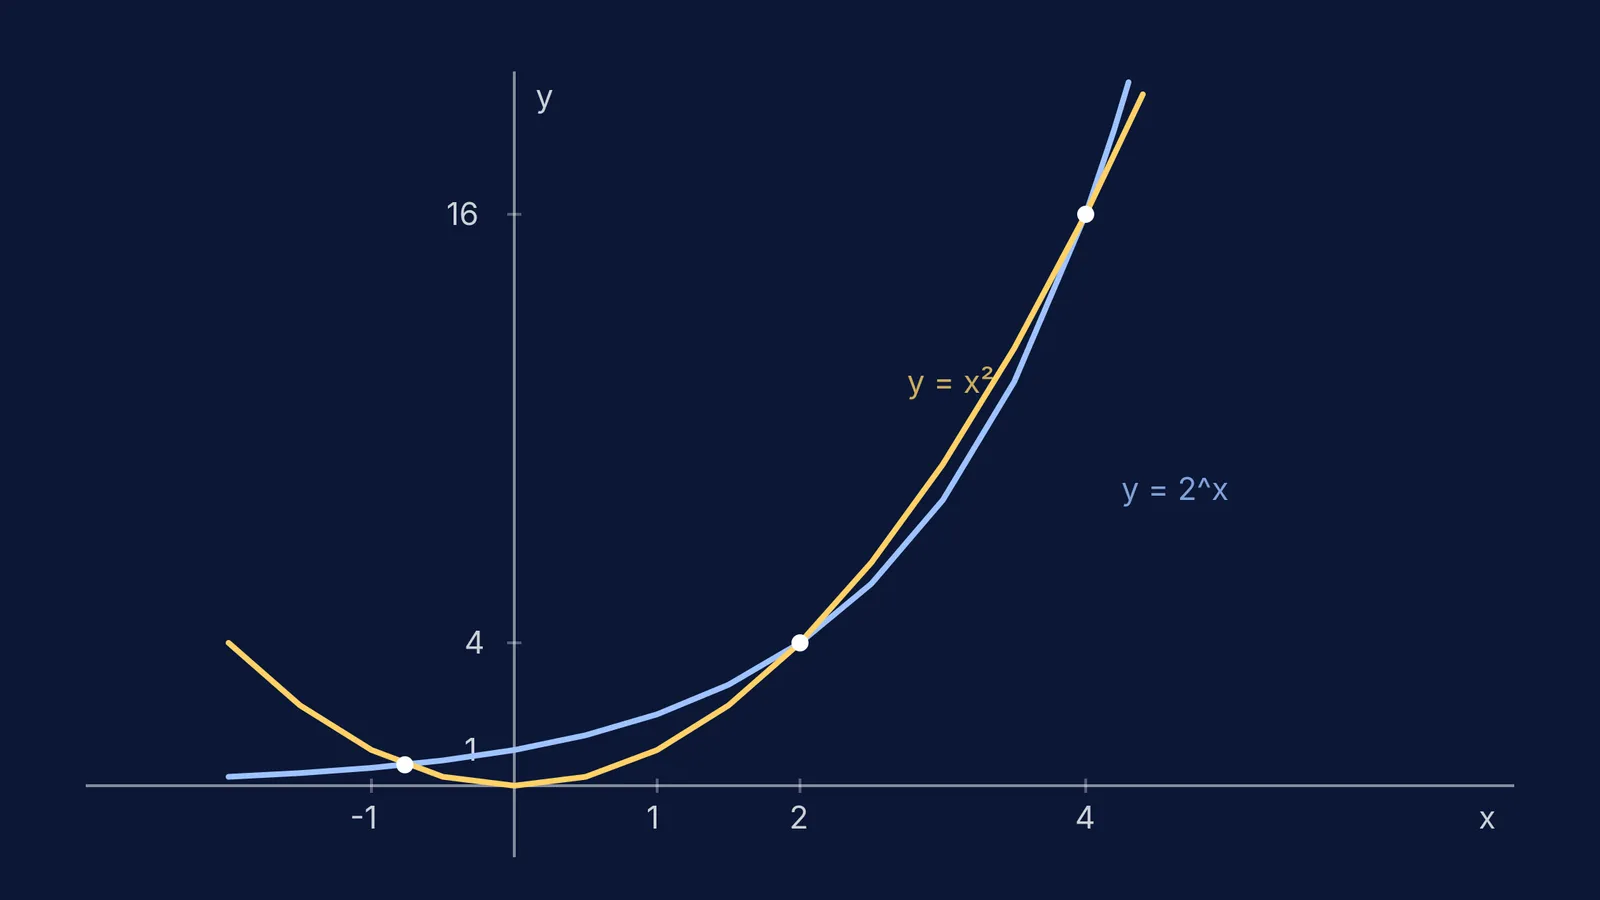
If you rely purely on algebraic guessing to solve the equation 2^x = x², you will probably find x = 2 and x = 4. However, this equation actually has a third solution at a negative value of x. When you are looking for the number of solutions of 2 power x equals x squared, guessing roots is a trap. Instead, the most reliable method is to sketch both sides as separate graphs and count where they intersect.
By graphing y = 2^x and y = x² on the same set of axes, you can clearly see the hidden negative solution. This visual approach is a staple of Fermi Problem Library, where step-by-step reasoning helps you avoid missing hard-to-find roots in algebra and calculus. When you train yourself to visualise mathematical relationships, you stop relying on incomplete algebraic tricks and start seeing the full picture.
Why does guessing roots miss solutions?
Equations mixing exponential and polynomial terms, like 2^x = x², are called transcendental equations. This means they cannot be solved completely using standard polynomial algebra. For a simple polynomial like x² - 5x + 6 = 0, you know from the fundamental theorem of algebra that there are exactly two roots, and factoring gives them to you. But transcendental equations do not follow this rule, so you cannot simply factor them to find every answer.
You can easily spot that 2² = 4 and 2² = 4, making x = 2 a valid root. Similarly, 2⁴ = 16 and 4² = 16, so x = 4 is also a solution. If you stop there, you miss a key piece of the puzzle. The function 2^x never becomes negative, but it does get very close to zero for negative values of x. Meanwhile, x² becomes positive when x is negative.
Because of this differing behaviour, the two curves must cross once more on the negative side of the y-axis. Checking for roots by counting curve intersections is a technique that keeps you from missing these hidden solutions. It shifts your perspective from hunting for numbers to analysing the geometry of the functions.
How do you sketch the two curves?
To find the total number of solutions, treat the left-hand side (LHS) and right-hand side (RHS) as two separate functions, y = 2^x and y = x². By plotting them together, you can pinpoint exactly where they share a coordinate.
Draw the parabola for y = x². It touches the origin at (0, 0) and curves upwards symmetrically in both the positive and negative directions.
Draw the exponential curve for y = 2^x. It passes through (0, 1), climbs steeply to the right, and flattens out towards the x-axis on the left.
Mark the points where the two curves cross.
Because the exponential curve y = 2^x starts at 1 on the y-axis (above the parabola's 0), but ends up below the parabola at x = -1 (where 2⁻¹ = 0.5, but (-1)² = 1), the two graphs must intersect somewhere between x = -1 and x = 0. This guarantees a third intersection.
We can also prove that there are no further intersections. For x > 4, the exponential growth of 2^x outpaces the polynomial growth of x², so the curves will never meet again. For x < -1, the parabola continues to rise towards infinity, while the exponential curve flattens towards zero, ensuring they stay apart. This gives us exactly three solutions in total.
Where else does this visual method help?
Sketching both sides of an equation works for almost any transcendental problem you will face in JEE, NEET or school mathematics. Whether you are counting intersections between trigonometric and polynomial functions (like sin x = x) or complex logarithmic curves, the graphing method tells you exactly how many roots exist without needing to solve for them.
If you are dealing with purely algebraic polynomials, such as when two quadratics share a root, you can still rely on the discriminant and algebra. However, the moment an exponential or trigonometric term appears, sketching is your safest move. It provides an immediate check on whether your analytical work has missed anything important.
If you are unsure how to sketch a tricky function, the Fermi Concept Library can help you build the habit of visualising equations before you try to solve them. By seeing the curves, you ensure that you never miss a hidden solution again, saving you valuable marks on difficult exam questions.


