

On this page
Concavity tells you which way a graph bends, and a point of inflection is where that bend flips. Both come from one sign chart for the second derivative, f″(x).
What do concave up and concave down mean?
A function is concave up on an interval if its slope f′ is increasing there, and concave down if f′ is decreasing, according to OpenStax Calculus Volume 1, section 4.5. The same section gives the working test: if f″(x) > 0 for every x in an interval, f is concave up there; if f″(x) < 0, it is concave down.
In pictures, a concave-up curve is a cup with its tangents below it; a concave-down curve is a cap with tangents above it. Concavity says nothing about whether f is rising or falling; that is the job of f′, covered in our guide to increasing and decreasing functions using the sign of f′(x).
How do you find points of inflection?
An inflection point is a point (a, f(a)) where f is continuous and changes concavity, in the definition used by OpenStax Calculus Volume 1. The book adds that a continuous function can switch concavity only where f″(x) = 0 or f″(x) is undefined, and may not switch even there. So:
Find f″(x) and factorise it.
List the candidates: every x where f″(x) = 0 or f″(x) does not exist, provided f is defined there.
Make a sign chart for f″ by testing one value in each interval between candidates.
Keep only the candidates where the sign of f″ changes, and get the y-coordinate from f, not from f′ or f″.
The opposite trap: for f(x) = x^(1/3), f″(x) = −(2/9)x^(−5/3) is never zero and is undefined at x = 0, yet it is positive for x < 0 and negative for x > 0. The origin is an inflection point, found only if step 2 includes where f″ is undefined.
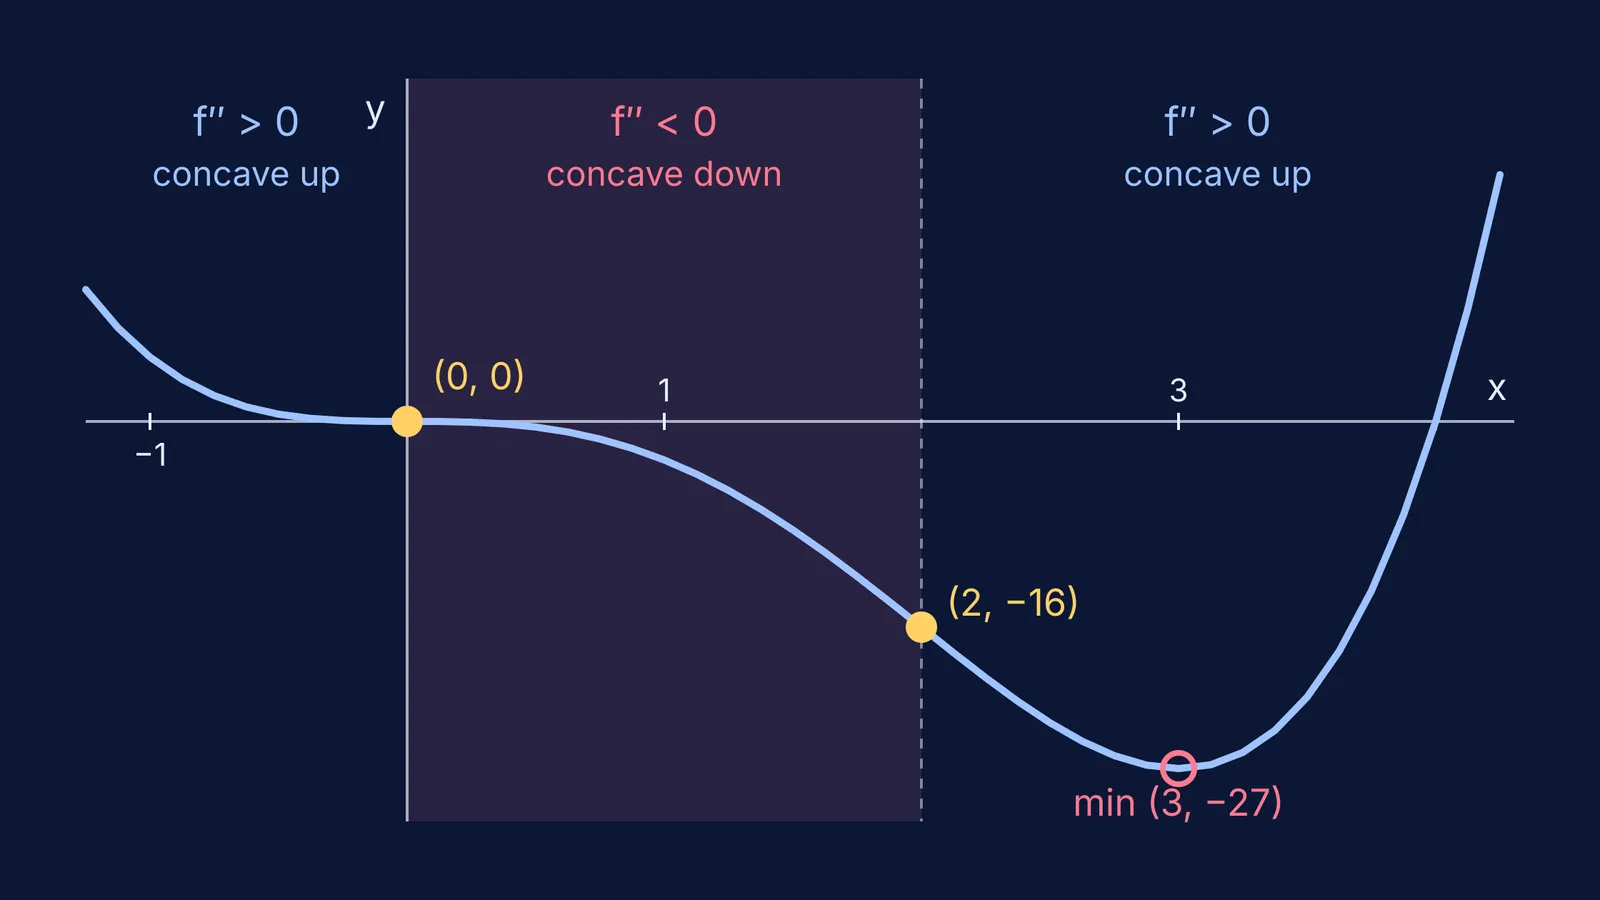
Worked example: f(x) = x⁴ − 4x³
f′(x) = 4x³ − 12x² = 4x²(x − 3)
f″(x) = 12x² − 24x = 12x(x − 2), so the candidates are x = 0 and x = 2.
Test x = −1: f″ = 36, positive, so concave up on (−∞, 0).
Test x = 1: f″ = −12, negative, so concave down on (0, 2).
Test x = 3: f″ = 36, positive, so concave up on (2, ∞).
The sign changes at both candidates, so the inflection points are (0, 0) and (2, −16), since f(2) = 16 − 32.
Now the critical points, where f′(x) = 0: x = 0 and x = 3. At x = 3, f″(3) = 36 > 0, so (3, −27) is a local minimum. At x = 0, f″(0) = 0 and the second-derivative test says nothing. Check f′ instead: f′(−1) = −16 and f′(1) = −8, both negative, so f keeps falling through x = 0. The origin is neither a maximum nor a minimum but a stationary point of inflection.
If a step like this trips you up, the Fermi Problem Library has worked problems with a step-by-step solver that explains the reasoning rather than printing an answer, so you can see which sign you misread.
What is the second-derivative test, and when does it fail?
The second-derivative test classifies a critical point c where f′(c) = 0 and f″ is continuous near c: if f″(c) > 0 there is a local minimum, if f″(c) < 0 a local maximum, and if f″(c) = 0 the test is inconclusive, as stated in OpenStax Calculus Volume 1. OpenStax shows the inconclusive case with three functions that all have f″(0) = 0: x⁴ has a minimum at 0, −x⁴ has a maximum, and x³ has neither.
When it fails, read the sign of f′ on either side of c instead. For word problems, see applications of derivatives: maxima, minima and rates of change; if computing f″ is the slow part, practise with second-order derivatives and relations like y″ + y = 0.
How do you read concavity off a graph?
Exam questions often give a picture instead of a formula. Check which graph you have first.
Graph of f: a cup is concave up, a cap is concave down. Inflection points are where the bend flips.
Graph of f′: f is concave up where f′ is rising and concave down where f′ is falling. Inflection points of f sit at the peaks and troughs of f′.
Graph of f″: f is concave up where f″ is above the axis. Inflection points are where f″ crosses the axis, not where it only touches it.
The most common slip is reading an f′ graph as if it were f. If the meaning of f″ still feels shaky, the Fermi Concept Library covers every concept in mathematics, each with its own lesson.
Your next step: take any cubic from your textbook, factorise f″ and draw its sign chart before you sketch the curve.


