

On this page
Why does a negative slope mean compression on a displacement graph?
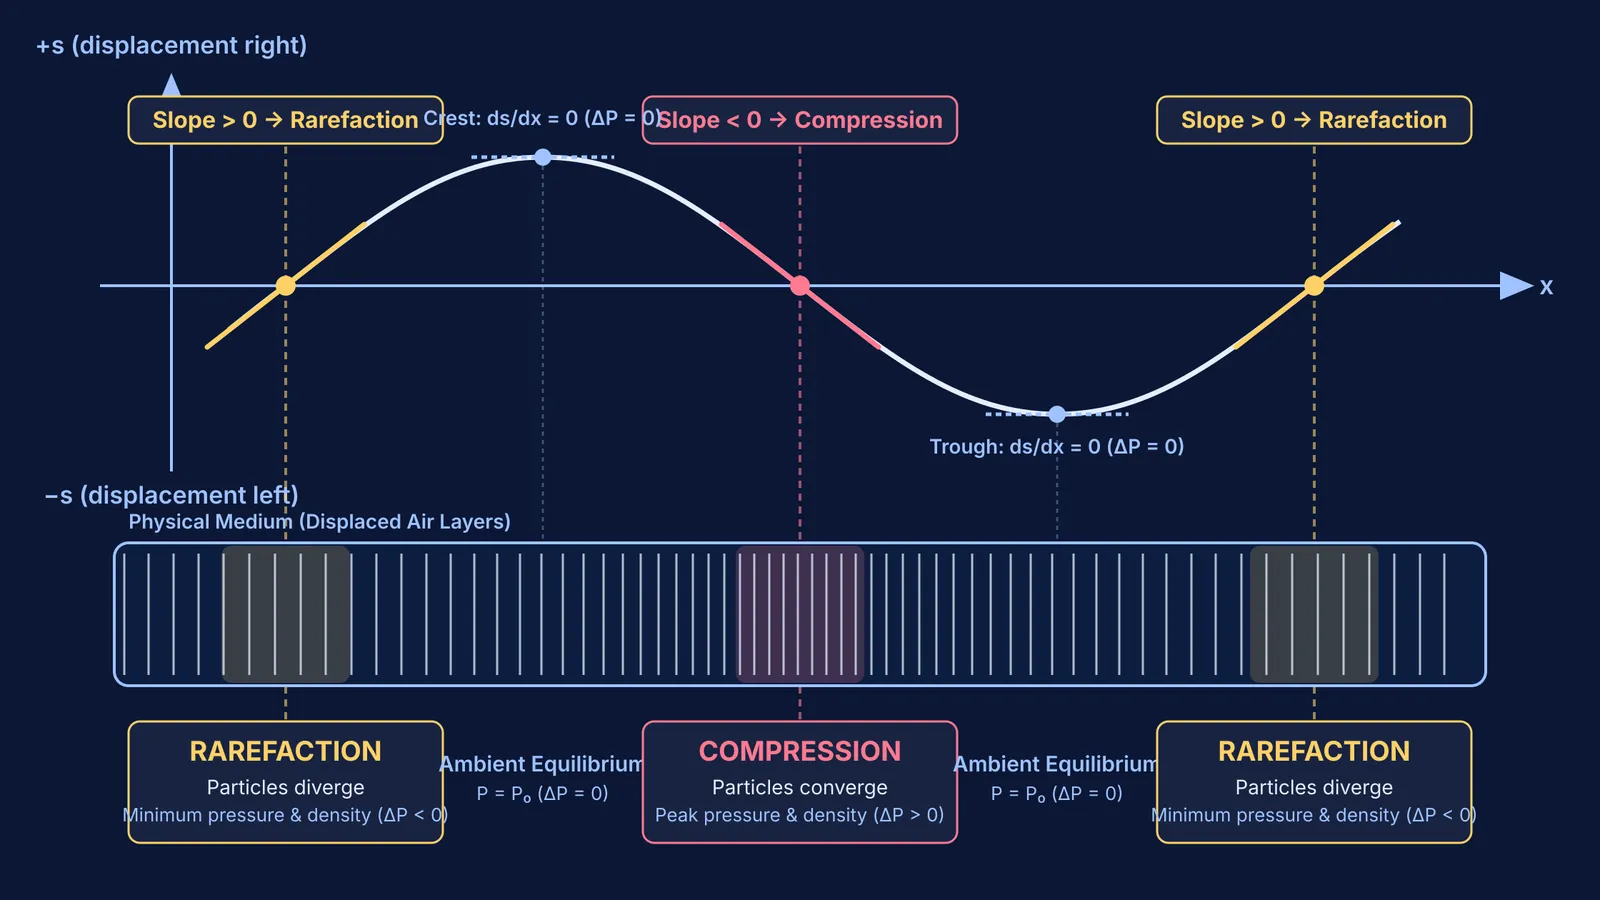
A displacement-position graph for a sound wave looks like a transverse wave, but air molecules oscillate parallel to wave propagation, as noted in the NCERT Class 11 Physics curriculum. On this graph, the vertical axis y (or s) represents longitudinal displacement along the x-axis: positive values mean forward displacement to the right, while negative values mean backward displacement to the left.
Now consider where the curve crosses y = 0 with a negative slope (tilting downward from left to right). Immediately to the left of this crossing, displacement is positive, so particles have moved right toward the crossing. Immediately to the right, displacement is negative, so particles have moved left toward the crossing. Because particles from both sides converge toward this zero-displacement point, the medium compresses into a region of maximum density and pressure.
The continuum mechanics of fluids confirms this intuitive picture. According to OpenStax University Physics Volume 1, excess pressure ΔP is given by ΔP = −B (∂s/∂x), where B is the bulk modulus and ∂s/∂x is the displacement gradient. When the slope ∂s/∂x is negative, the negative sign in the bulk modulus equation yields a positive pressure excess (ΔP > 0). Maximum downward slope at y = 0 corresponds to peak compressive pressure.
Where do rarefactions appear on a longitudinal wave graph?
A rarefaction is the opposite of a compression: a region where medium density and pressure drop below ambient equilibrium. On a displacement-position graph, this occurs wherever the curve crosses y = 0 with a positive slope. Immediately to the left, displacement is negative (particles shifted left); immediately to the right, displacement is positive (particles shifted right). Particles pull away from the crossing point, creating a localized drop in density.
Applying the bulk modulus relation ΔP = −B (∂s/∂x) from OpenStax University Physics Volume 1, a positive slope yields a negative excess pressure (ΔP < 0). At y = 0 with steepest positive slope, gauge pressure reaches its minimum, marking a rarefaction. This creates the 90° (π/2 radian) phase shift between displacement and pressure waves analyzed in our guide on displacement and pressure waves in sound.
This distinction is frequently misunderstood. Research in the *International Journal of Science Education* found that only 9% to 22% of introductory physics students initially recognized longitudinal particle oscillation in sound waves, with up to 50% describing particles as pushed linearly or along the curve of the sinusoidal graph (Wittmann et al., 2003). While standard lectures left correct responses at just 26%, targeted active-learning tutorials raised conceptual accuracy up to 68%. For students who want to test their mental model dynamically, the Fermi Simulation Lab provides interactive simulations for the ideas that are easier to see than to read.
What happens at the crests and troughs of the wave?
A common exam trap in JEE Main and NEET-UG is mistaking a displacement crest for a compression. At both crests (y = +s_max) and troughs (y = −s_max), the tangent to the curve is horizontal, so the spatial slope ∂s/∂x is zero. Per the bulk modulus formula in OpenStax University Physics Volume 1, when ∂s/∂x = 0, the pressure variation ΔP is zero.
At these peaks and valleys, air parcels reach their maximum physical excursion, but neighbouring parcels have shifted by nearly identical amounts. Because there is no relative squeezing or stretching between adjacent layers, local density and pressure remain at normal atmospheric equilibrium (P = P₀). Crests and troughs represent maximum displacement, not maximum pressure.
How do you solve displacement graph problems step by step?
When analyzing any longitudinal displacement-position graph in an exam, use this three-step protocol:
Verify the axis convention: confirm that positive y means displacement along +x (right) and negative y means displacement along −x (left).
Inspect zero crossings (y = 0): negative slope means compression; positive slope means rarefaction.
Check crests and troughs: horizontal slope means ambient equilibrium pressure (ΔP = 0) with maximum displacement.
Consider a progressive wave at t = 0 described by s(x) = s₀ sin(kx) with wavelength λ = 4.0 m, based on the harmonic wave model in OpenStax University Physics Volume 1 and analyzed in our walkthrough on reading travelling wave equations:
x = 0 m: s = 0, ds/dx > 0 (positive slope). Particles diverge, creating a rarefaction.
x = 1.0 m (λ/4): s = +s₀, ds/dx = 0 (crest). Maximum forward displacement, ambient pressure.
x = 2.0 m (λ/2): s = 0, ds/dx < 0 (negative slope). Particles converge, creating a compression.
x = 3.0 m (3λ/4): s = −s₀, ds/dx = 0 (trough). Maximum backward displacement, ambient pressure.
x = 4.0 m (λ): s = 0, ds/dx > 0 (positive slope). Particles diverge, creating the next rarefaction.
This framework also links directly to converting phase difference and path difference. The Fermi Problem Library offers worked problems with a step-by-step solver that explains the reasoning rather than printing an answer. To see how acoustics fits into the wider physics syllabus, the Fermi Concept Library includes every concept in physics, chemistry, biology, mathematics and computing, each with its own lesson and its place in the map.


