

On this page
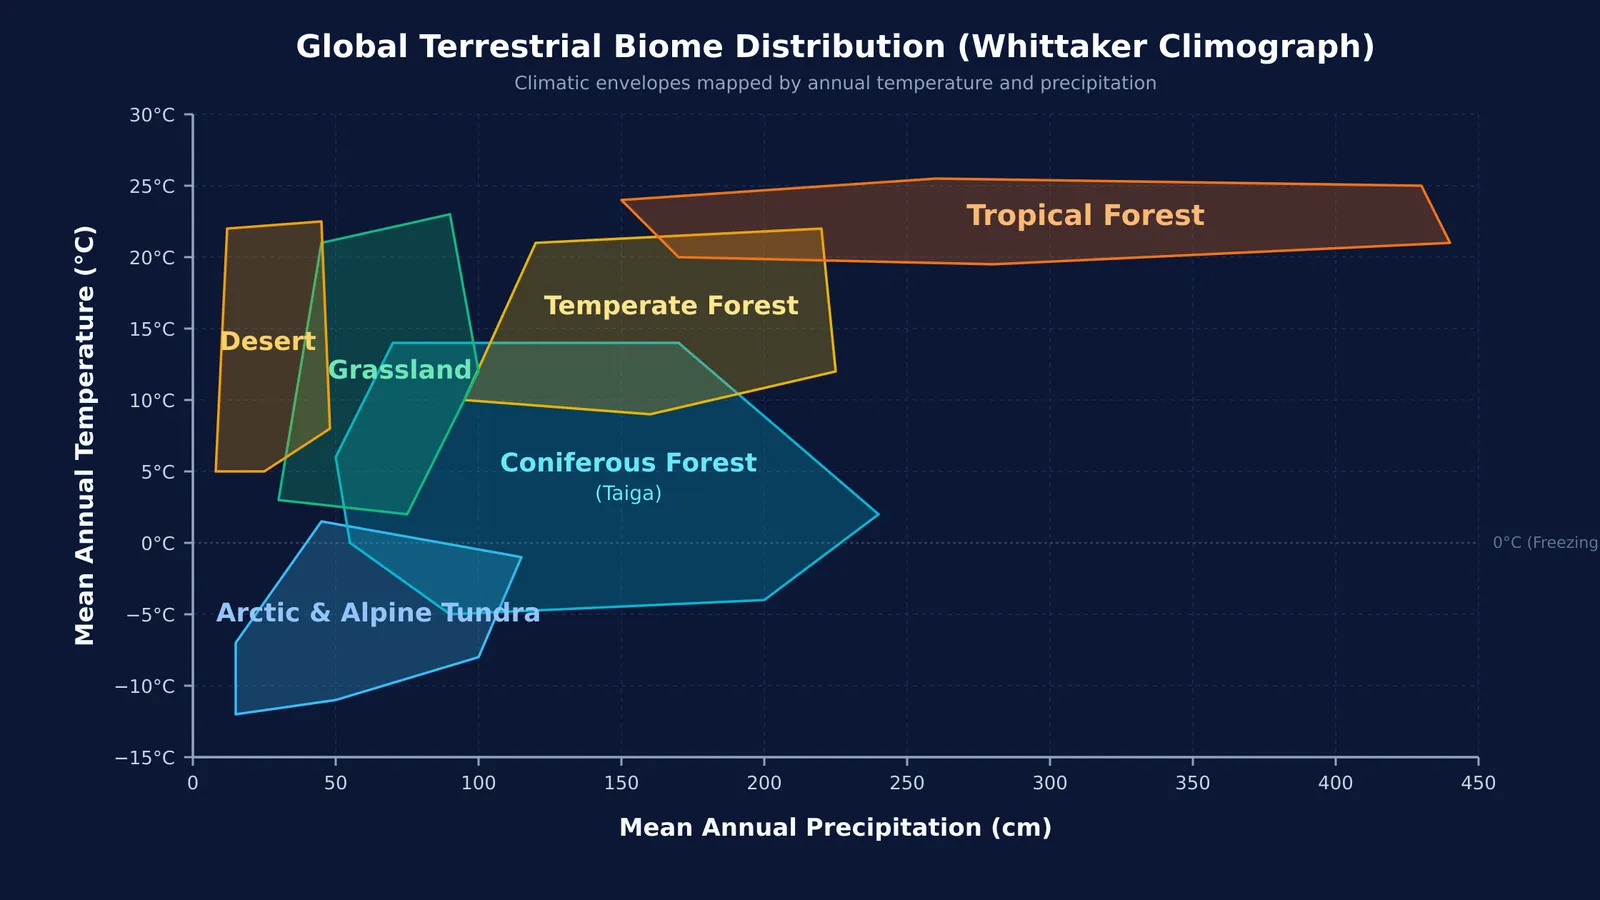
When you look at a global vegetation map, the boundaries between biomes can seem chaotic. Yet replotting those ecosystems on a two-dimensional graph of mean annual temperature against mean annual precipitation brings immediate order. Pioneered by American ecologist Robert H. Whittaker in his classic study of community classification and later codified in his 1975 book *Communities and Ecosystems*, this climograph reveals how two primary abiotic variables govern where life thrives.
For students preparing for competitive exams, understanding this graph is not merely an exercise in memorizing coordinates. It reveals the physiological constraints under which organisms adapt, from the dense canopy of the Western Ghats to the frozen scree of high Himalayan slopes.
How do temperature and rainfall determine major biomes?
The formation of Earth's major biomes begins with orbital mechanics. The rotation of our planet around the Sun and the 23.5° tilt of its axis produce annual variations in solar intensity and temperature, establishing distinct seasons as described in NCERT Class 12 Biology. When combined with annual variations in precipitation (both rain and snow), these thermal gradients create major biomes.
On the standard climograph, the biome envelope forms an asymmetrical triangle. High annual precipitation requires warm air that can hold abundant moisture, expanding the right side of the chart toward tropical rainforests. Conversely, sub-zero temperatures sharply limit atmospheric moisture, compressing the cold base toward tundra. Within each biome, regional topography and local soil conditions generate varied habitats, a foundational principle explored in Organisms and populations: growth models and species interactions.
What are the climatic ranges for the six major biomes?
The standard climograph in NCERT Class 12 Biology defines six major terrestrial biomes by their climatic envelopes:
Tropical forest: Mean annual temperature of 20°C to 25°C and annual precipitation of 150 cm to 450 cm, sustaining layered evergreen canopies and high biodiversity.
Grassland: Mean annual temperatures of 0°C to 25°C with precipitation between 50 cm and 100 cm. Trees are sparse because rainfall cannot support closed canopies; Bond, Woodward, and Midgley (2005) demonstrated that recurring fires also prevent woody encroachment.
Desert: Mean annual temperature between 5°C and 22°C with precipitation below 50 cm. Vegetation relies on xerophytic adaptations, extensive roots, and Crassulacean Acid Metabolism (CAM) photosynthesis.
Temperate forest: Mean annual temperature of 10°C to 22°C and precipitation of 100 cm to 200 cm, supporting broadleaf deciduous trees adapted to seasonal frost.
Coniferous forest (Taiga): Mean annual temperature from −5°C to 15°C and precipitation between 50 cm and 250 cm. Dominated by needle-leaved evergreens with thick cuticles and sunken stomata.
Arctic and alpine tundra: Mean annual temperature of −12°C to 2°C and precipitation of 10 cm to 125 cm, supporting dwarf perennials, lichens, and mosses over permafrost.
To explore how these climatic limits shape biological hierarchies, the Fermi Concept Library covers every concept in biology, each with its own lesson and its place in the map.
Where do Indian ecosystems fit on the biome chart?
India's diverse topography spans multiple global biome categories. The researcher who first built this ecological foundation in India was Ramdeo Misra, the botanist who built ecology research in India, pioneering tropical ecosystem analysis at Banaras Hindu University.
According to NCERT Class 12 Biology, India features four primary biomes alongside high-altitude montane zones:
Tropical rain forest: Found in the Western Ghats, Northeast India, and the Andaman and Nicobar Islands. Stations like Mawsynram receive over 1,000 cm of annual rainfall according to the India Meteorological Department.
Deciduous forest: India's most widespread forest type, covering the Deccan plateau and Gangetic plain, where teak and sal shed leaves during dry summer months.
Desert: Hot arid tracts in the Thar Desert of Rajasthan, where Jaisalmer records under 20 cm of annual precipitation at the India Meteorological Department, alongside the cold desert of Ladakh.
Sea coast: Extending across 7,500 kilometres of coastline, featuring tidal estuaries and mangrove systems such as the Sundarbans.
Alpine tundra: Located above the Himalayan tree line above 3,500 metres elevation, where alpine meadows (Bugyals) mirror polar tundra conditions.
How can you solve biome climograph questions in exams?
Exam questions based on the NCERT Class 12 Biology climograph often present an unlabelled diagram and ask you to identify lettered zones. You can resolve any region systematically using four diagnostic steps:
Check the thermal floor: If temperature drops below 0°C, the biome is either coniferous forest or tundra; if it reaches −12°C, it is tundra.
Check the precipitation upper bound: If rainfall extends to 450 cm while temperature stays near 25°C, the zone is tropical forest.
Separate deserts from grasslands: Both span warm temperatures, but deserts stop below 50 cm of rainfall, while grasslands reach 100 cm.
Separate temperate from coniferous forests: Temperate forests remain above 9°C, while coniferous forests drop to −5°C.
Connecting coordinates to structural adaptations prevents costly errors in exams, as highlighted in Ecology for NEET: food chains, pyramids and population questions. To practice diagram questions, the Fermi Problem Library features worked problems with a step-by-step solver that explains the reasoning rather than printing an answer. For visual learners, the Fermi Simulation Lab provides interactive simulations for the ideas that are easier to see than to read.


