

On this page
A 5-mark biology answer is not marked on length. The examiner checks it against a list of points, each worth a set part of the marks, and flowcharts and tables make those points easy to find.
Why do flowcharts and tables score in biology board answers?
The CBSE Class 12 biology sample paper for 2026-27 has 33 questions for 70 marks, and Section E has 3 questions of 5 marks each. Its general instructions say that, wherever necessary, neat and properly labelled diagrams should be drawn.
In the 2026-27 biology marking scheme, the steps of DNA isolation are written as a chain: break open cells → DNA released with RNA, proteins and other molecules, then, once those are removed, add chilled ethanol → DNA precipitates as white threads. The composting question is answered as a four-row table (fragmentation, leaching, catabolism, humification and mineralisation), with 1 mark printed against each row.
There is a learning reason too. A meta-analysis by Nesbit and Adesope pooled 55 studies with 5,818 participants and found that constructing, modifying or viewing concept maps (node-link diagrams) was associated with better knowledge retention, though the size of the effect varied with how the maps were used.
For how examiners award part marks, see our guide to using CBSE marking schemes to write answers that earn the marks.
How do you write a biology long answer with a flowchart?
Use the same four parts every time:
Define the process in one sentence, so the examiner sees at once that you know what it is.
Chain the steps: one box per step, with the place (organ, organelle, enzyme) in the box and the action on or beside the arrow.
Add the details examiners look for: names of enzymes, hormones or structures, and any standard figure from NCERT.
Close with one sentence on why the process matters.
Keep a flowchart to six to eight boxes, with all arrows in one direction, drawn in pen with a ruler.
Worked example: how to answer urine formation for 5 marks
Question: Describe the process of urine formation in humans.
Definition: Urine forms in the nephron through three processes: glomerular filtration, reabsorption and secretion.
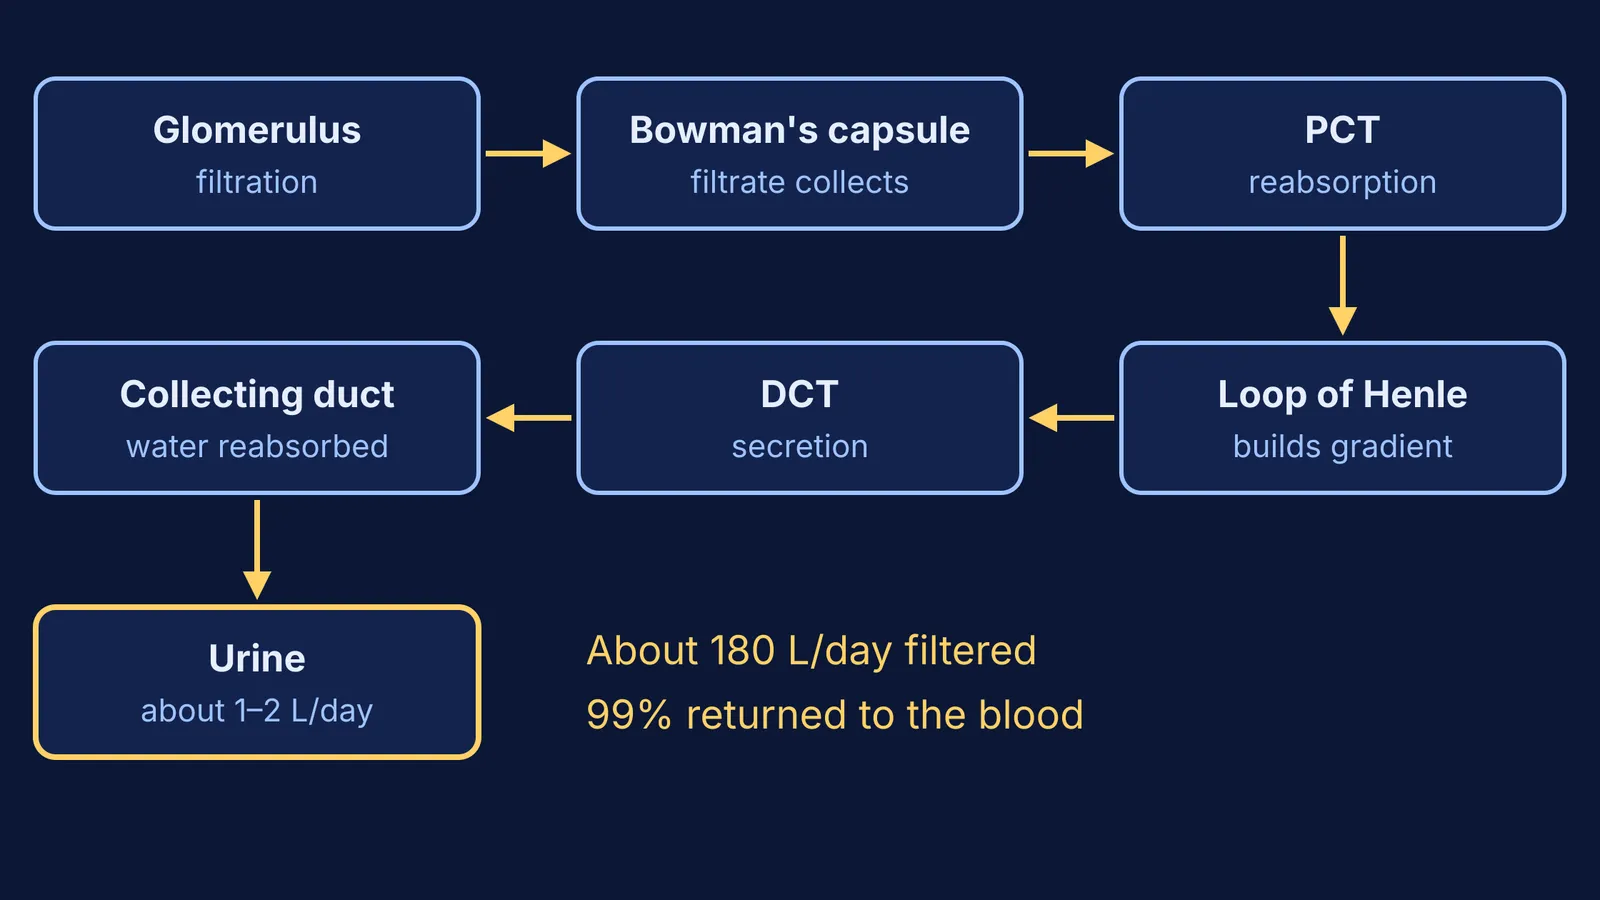
Flowchart, written down the page:
Blood enters the glomerulus → filtration under pressure
Filtrate collects in Bowman's capsule
Proximal convoluted tubule (PCT) → reabsorption of useful substances and water
Loop of Henle → concentration gradient in the medulla
Distal convoluted tubule (DCT) → reabsorption and secretion
Collecting duct → more water reabsorbed → urine
Key figures: men's kidneys make about 125 mL of filtrate a minute, about 180 L a day, according to the OpenStax Anatomy and Physiology text on urine formation. The same source says 99% of this filtrate returns to the blood, leaving only 1 to 2 L of urine a day. In the exam, quote the figures in your NCERT chapter.
Closing line: Reabsorption lets the body keep water and nutrients while removing wastes.
Worked example: DNA replication as a step table
DNA replication suits a table, because each step has an enzyme and an action. On paper, draw three columns: step, enzyme, what happens. The rows below follow OpenStax Biology:
Unwinding: helicase breaks the hydrogen bonds between base pairs and opens a replication fork.
Priming: primase makes a short RNA primer complementary to the DNA.
Elongation: DNA polymerase adds nucleotides only in the 5' to 3' direction.
Two strands: the leading strand is made continuously; the lagging strand is made in short Okazaki fragments.
Finishing: the RNA primers are replaced by DNA, and DNA ligase seals the gaps.
Add a labelled sketch of the fork showing the direction of each new strand, and end with one line on why replication matters: each new cell gets a copy of the DNA. For the experiment behind the model, see our post on Meselson and Stahl and heavy nitrogen.
When should you use a table instead of a flowchart?
Pick the format from the question word:
"Describe the process", "trace the path", "explain the steps": flowchart.
"Differentiate", "compare", "give differences": two-column table with matched rows, such as leading versus lagging strand.
"List the stages and their role": step table, as CBSE did for composting.
A cycle (menstrual cycle, Krebs cycle): a loop of arrows that returns to the start.
Flowcharts only work when you understand the order of steps. If a stage keeps slipping, revise it in the Fermi Concept Library, where every biology concept has its own lesson and its place in the map. Then practise writing timed answers, using our plan for the CBSE Class 12 biology paper to decide which processes to drill first.


