

On this page
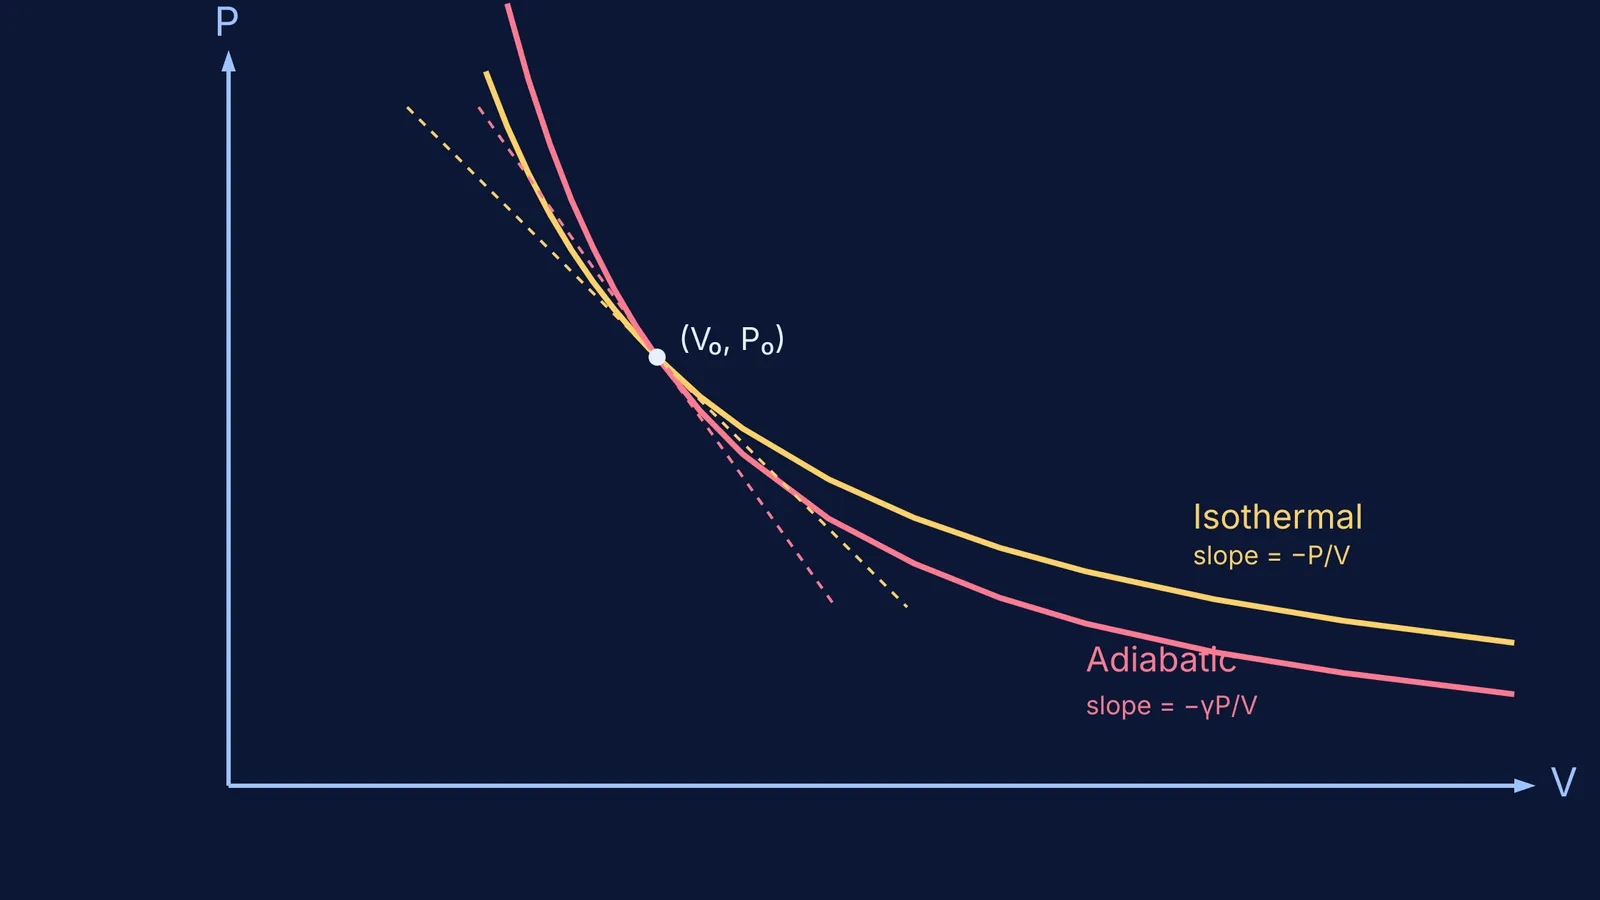
On a pressure-volume (P-V) diagram, the area under the curve gives the work done by or on the gas. But the steepness of the curve—its slope—tells you how rapidly the pressure changes as the volume changes. When comparing two processes starting from the exact same state (the same pressure and volume), their slopes reveal fundamental differences in how heat and energy are exchanged.
An isothermal process keeps the temperature constant. If a gas expands isothermally, it must absorb heat from its surroundings to compensate for the work it does. This added heat keeps the pressure from dropping too rapidly.
An adiabatic process allows no heat to flow in or out. When a gas expands adiabatically, it does work using its own internal energy. As it expends this energy, its temperature drops. Because the volume is increasing and the temperature is simultaneously falling, the pressure plunges much faster than it does in the isothermal case.
What is the slope of an isothermal curve?
To find exactly how much steeper the curve is, we need to calculate the slope, which is the derivative dP/dV.
For an isothermal process involving an ideal gas, Boyle's law applies. The equation of state is: PV = constant
To find the slope, we differentiate both sides with respect to the volume V. Using the product rule: P(1) + V(dP/dV) = 0
Rearranging this to solve for dP/dV gives: dP/dV = −P/V
This tells us that at any given point (V, P), the slope of the isothermal curve is exactly −P/V. The negative sign indicates that as volume increases, pressure decreases.
What is the slope of an adiabatic curve?
For an adiabatic process, the relationship between pressure and volume is given by the adiabatic condition: PV^γ = constant
Here, γ (gamma) is the ratio of specific heats (Cp/Cv). As outlined in OpenStax University Physics, γ ≈ 1.67 for a monatomic gas, and γ = 1.4 for a diatomic gas like the air we breathe.
Differentiating both sides with respect to V using the product rule: P(γV^(γ−1)) + V^γ(dP/dV) = 0
Divide the entire equation by V^(γ−1) to simplify it: γP + V(dP/dV) = 0
Solving for the slope gives: dP/dV = −γP/V
Comparing this result to the isothermal slope reveals a direct mathematical relationship. The adiabatic slope is exactly γ times the isothermal slope at the same point. Because γ is always strictly greater than 1, the adiabatic slope is a larger negative number. In other words, it is steeper.
How to tell the two curves apart on a P-V graph?
In exams like JEE Main or NEET-UG, you are often given a P-V diagram with multiple curves starting from the same point and asked to identify which is which. You can do this by looking at the steepness.
During expansion: When the gas expands (volume increases, moving to the right on the graph), both curves drop. The lower curve—the one that plunges more steeply—is the adiabatic process. The upper curve is the isothermal process.
During compression: When the gas is compressed (volume decreases, moving to the left), both curves rise. The steeper curve is again adiabatic, making it the upper curve. The lower curve is isothermal.
If you are stuck on a question about identifying thermodynamic cycles, the Fermi Problem Library has worked problems with a step-by-step solver that explains the reasoning. If you need to trace how pressure changes across different axes, read our guide on converting PV, PT and VT graphs.
How does this look in a worked example?
Suppose you have an ideal diatomic gas (γ = 1.4) at a pressure of 100,000 Pa and a volume of 2 m³.
The isothermal slope at this point is: −P/V = −100,000 / 2 = −50,000 Pa/m³
The adiabatic slope at the exact same point is: −γP/V = −1.4 × (100,000 / 2) = −70,000 Pa/m³
At this exact instant, the adiabatic curve is falling at a rate of 70,000 Pa for every cubic metre of expansion, while the isothermal curve falls at only 50,000 Pa. (For more on rapid gas changes where heat cannot escape, see our post on the free expansion of an ideal gas).


